Geoscience Reference
In-Depth Information
During the glacial a clear correlation between the seasonal cycles of dust concen-
tration and size can be found (r = 0.8). During T1, beginning from 19 ka BP, the
correlation decreases to values below 0.4 in the Holocene.
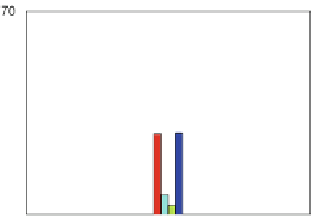
For all time slices the simulated dust deposition in Antarctica is increased rel-
ative to the pre-industrial CTRL (Fig.
2
b). In the mid-Holocene, dust deposition is
increased by a factor of 3.8, and in the Eemian by a factor of 2.7. Dust deposition in
the last glacial inception is only slightly enhanced. The highest dust deposition in
Antarctica is simulated for the LGM, showing a 10.2-fold increase compared to
CTRL.
The modeled increase in dust concentration (dust deposition rate divided by
precipitation)
fits to the results from ice cores for 115 and 126 ka BP (see Fig.
2
a).
However the model overestimates the 6 ka BP to pre-industrial ratio substantially
likely due to overestimation of the South American and Australian dust sources.
The prescribed vegetation is the main source of uncertainty in our model simula-
tions of the dust cycle for past time slices. The dust concentration in Antarctic ice
for the LGM is further enhanced by the strongly reduced precipitation.
(a)
(b)
6ka/0ka
115ka/0ka
126ka/0ka
21ka/0ka
(c)
(d)
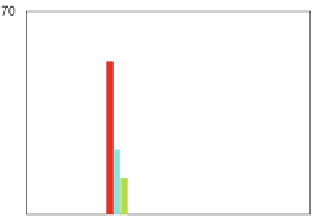
Fig. 2 a Ratios of dust mass concentration in the Antarctic ice for model simulations and
observations for 6, 115, 126 ka BP and 21 ka BP with respect to pre-industrial. The records shown
in dark colours represent Coulter Counter data from the literature. Data from the closest model grid
point are shown in light colours. b Integrated modelled dust deposition in Antarctica [Tg/season];
c Modelled southern hemisphere dust emissions [Tg/season]; d Number of trajectories/season
originating at 500 and 800 hPa from dust source grid boxes and reaching Antarctica within 10 days


Search WWH ::

Custom Search