Environmental Engineering Reference
In-Depth Information
surface for loading conditions (Figs. 13.23b) are
∂e
∂
log
σ
−
u
a
C
t
=
(13.74)
∂e
∂
log
u
a
−
u
w
C
m
=
(13.75)
where:
C
t
=
compressive index with respect to net normal stress
σ
−
u
a
and
C
m
=
compressive index with respect to matric suction
u
a
−
u
w
.
For the unloading surface, the indices are subscripted with
an
s
as
C
ts
and
C
ms
. The volumetric deformation indices
associated with the water content surface for loading condi-
tions (Fig. 13.24b) can be defined as
∂
w
∂
log
σ
−
u
a
D
t
=
(13.76)
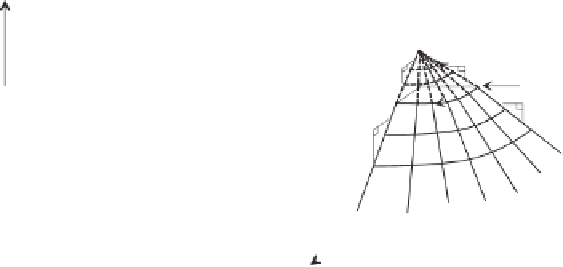
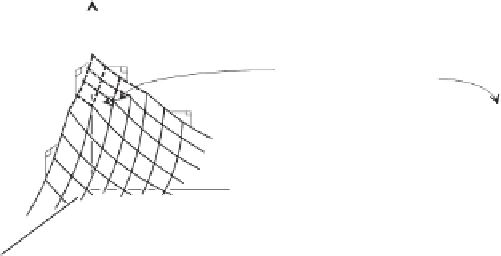
Figure 13.22
Water phase constitutive surface for monotonic
unloading of stable-structured soil.
∂
w
∂
log
u
a
−
u
w
D
m
=
(13.77)
the
a
ms
/b
ms
ratio obtained from the slope of the unconfined
swelling test presented in Fig. 13.20 (i.e., the opposite of a
shrinkage curve). The slope of the swelling curve is defined
where:
as
de/
dw
or
∂e/∂
u
a
−
u
w
/
∂
w
/∂
u
a
−
u
w
, which is
equal to
a
ms
/b
ms
.
D
t
=
water content
index with respect
to net normal
stress
σ
−
u
a
and
D
m
=
water content index with respect to matric suction
u
a
−
u
w
.
13.5.5 Constitutive Surfaces on Semilogarithm Plot
The constitutive surfaces can be plotted with respect to the
logarithm of the stress state variables (Figs. 13.23b and
13.24b). The logarithm plots are linear over a relatively large
Similarly, the water content indices are subscripted with
an
s
for the unloading surface (i.e.,
D
ts
and
D
ms
).
The
C
t
,
C
m
,
D
t
, and
D
m
indices can be obtained from
the same test data used to obtain the
a
t
,
a
m
,
b
t
, and
b
m
deformation coefficients. The difference between the soil
properties lies in the manner in which the results are plotted.
stress range on the extreme planes [i.e., the log
u
a
−
u
w
≈
0 plane and the log
σ
−
u
a
≈
0 plane]. The slopes of the
curves on these extreme planes are called indices. The vol-
umetric deformation indices associated with the void ratio
a
ms
C
ts
C
ms
Constant-volume
stress path
a
ts
e
0
e
0
C
m
a
m
C
t
a
t
log (
u
a
-
u
w
)
(
u
a
-
u
w
)
Legend
Swelling or rebound
Compression
(a)
(b)
Figure 13.23
Void ratio constitutive surface for unsaturated soil: (a) arithmetic plot of stress
state variables versus void ratio; (b) semilogarithmic plot of stress state variables versus void ratio.


Search WWH ::

Custom Search