Environmental Engineering Reference
In-Depth Information
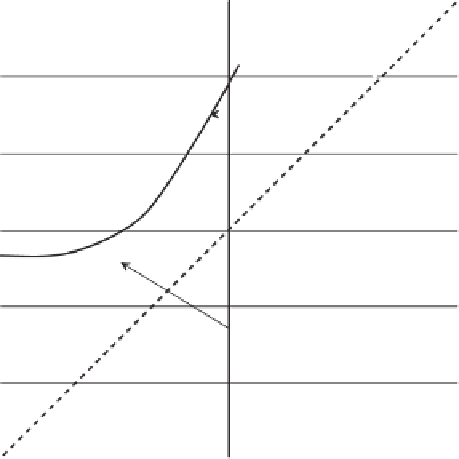
soil parameters which have physical meaning. The shrinkage
curve equation is meant for the simulation of the drying of
a soil.
The
a
sh
parameter represents the minimum void ratio cor-
responding to the shrinkage limit of the soil. The relationship
between void ratio and gravimetric water content is linear if
the degree of saturation,
S
, remains constant during shrink-
age. The slope of the relationship between void ratio and
water content is related to the initial volume-mass proper-
ties. The slope of the line tangent to the initial portion of
the shrinkage curve is equal to
a
sh
/b
sh
. The effect of varying
the
a
sh
parameter can be seen in Fig. 2.22:
A
Δ
V
a
= 0
Δ
V
a
≠
0
B
D
C
Constant degree
of saturation,
S
a
sh
b
sh
=
G
s
S
(2.8)
The influence of changing the
b
sh
parameter is shown in
Fig. 2.23. The
b
sh
parameter is equal to the slope of the degree
of saturation line on the shrinkage plot. Equation 2.8 shows
that once the minimum void ratio of a soil is known, the
b
sh
parameter can be calculated for a specific degree of saturation.
The
c
sh
equation parameter controls the rate of curvature
of the shrinkage curve as the soil begins to desaturate, as
shown in Fig. 2.24. The parameter,
c
sh
varies somewhat
depending on the soil type and the initial state of the soil.
Gravimetric water content (%)
Figure 2.19
Volume-mass shrinkage curve for initially unsatu-
rated soil specimen (from M.D. Fredlund et al., 2002a).
where:
2.2.4.2 Estimation of Shrinkage Curve
The volume change of a soil specimen is commonly not
measured when performing a laboratory test for the SWCC.
The basic experimental data from a SWCC test generally
consists of gravimetric water content versus soil suction. The
shrinkage curve can be used in conjunction with the SWCC
equation to compute the void ratio-soil suction relationship.
The ratio between the
a
sh
and
b
sh
shrinkage curve equation
parameters is fixed by the initial degree of saturation
S
and the
specific gravity
G
s
. There are two additional parameters to
determine:
a
sh
and
c
sh
. Values for the curvature of the shrink-
age curve,
c
sh
, can be estimated based on regression analyses
a
sh
=
minimum void ratio,
e
min
,
b
sh
=
slope of the line of tangency,
c
sh
=
curvature of the shrinkage curve,
a
sh
/b
sh
=
G
s
/S
=
constant for a specific soil, and
w
=
gravimetric water content.
A least-squares fitting algorithm can be used to fit the
shrinkage curve equation to various data sets. A typical fit of
the data for an initially saturated soil is shown in Fig. 2.21.
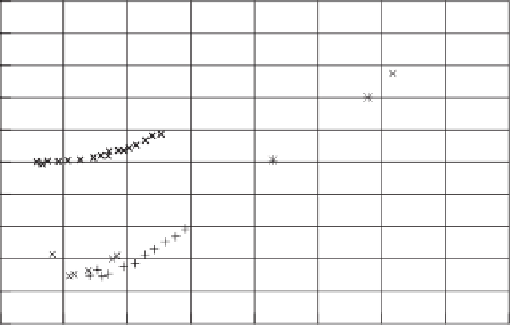
The proposed shrinkage curve equation can describe a wide
variety of shrinkage curves. The effects of soil structure and
initial degree of saturation can be accommodated through
2.2
2.0
1.8
1.6
1.4
1.2
1.0
0.8
0.6
0.4
0.2
0
10
20
30
40
50
60
70
80
Gravimetric water content, %
Figure 2.20
Typical soil shrinkage data for variety of soils with different initial volume-mass
properties (from M.D. Fredlund, 2002a).


Search WWH ::

Custom Search