Environmental Engineering Reference
In-Depth Information
diameter and soil specimen thickness has been shown to
provide satisfactory accuracy for the volume of small dry-
ing specimens (Ho, 1988; D.G. Fredlund et al., 2011). The
shrinkage curve provides an important visual link between
changes in the consistency of a soil and the stress state in
the soil.
The shrinkage curve can be measured for a soil that is either
initially in a slurry state or in some other unsaturated soil
state (e.g., compacted soil). The water content and void ratio
of the soil are measured as the soil is gradually dried to zero
water content. A mathematical representation of the shrink-
age curve provides a relationship between volume and mass
on the constitutive surfaces in response to an increase in soil
suction. The shrinkage curve is part of constitutive behavior
for an unsaturated soil and can be used in conjunction with a
SWCC to determine the relationship between volume change
(i.e., void ratio or specific volume), and soil suction.
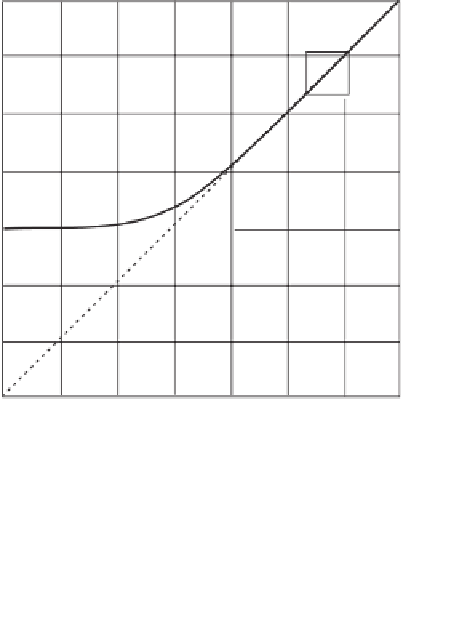
Shrinkage curves can be represented as either the specific
volume versus water content or void ratio versus water con-
tent (Haines, 1923). A typical shrinkage curve is shown in
Fig. 2.17. Particle-size distribution and stress history are the
primary factors controlling shrinkage behavior. There are
three main initial states from which soil shrinkage can be
measured: (i) undisturbed samples from the field, (ii) com-
pacted soil specimens, and (iii) slurry specimens prepared
near the liquid limit.
Drying of a saturated soil (e.g., starting at point
A
)fol-
lows the saturation line until air begins to enter the largest
soil voids at point
B
(Fig. 2.17). Point
B
is an indication
of the air-entry value (AEV) of an initially slurry soil. As
the soil continues to dry, it reaches a minimum void ratio
beyond which there is no further volume change. When the
water content of the soil reaches zero, the soil suction has
increased to 1,000,000 kPa (i.e., point
D
).
120
G
s
= 2.75
60
70
80
90
110
S
= 50 %
100
Slurry
soil
Minimum
void ratio
90
80
Air-entry value
70
60
50
40
S
=100 %
30
20
Solids
10
0
0 0 030
40
50
60
70
80
Water content, %
Figure 2.18
Volume-mass relationships for drying of initially
slurry soil.
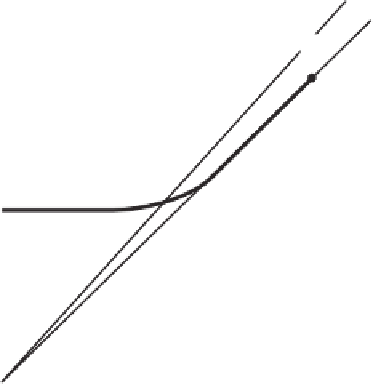
The water content at the intersection between the min-
imum void ratio and the saturation line is defined as the
“shrinkage limit” (Fig. 2.18). A somewhat different shrink-
age pattern is observed when soils are dried from degrees of
saturation less than 100% (Fig. 2.19). Point
A
in Fig. 2.19 is
a hypothetical starting point for drying a soil that is initially
unsaturated. If the soil maintains a constant ratio of air to
water in the voids as the soil dries, a constant degree of sat-
uration line will be followed that is less than 100%. The line
will pass through point
B
. If the volume of air remains con-
stant during the drying process (i.e., passing through point
C
), the degree of saturation decreases and move toward zero
degree of saturation (point
D
).
A
G
s
1
Air-entry value
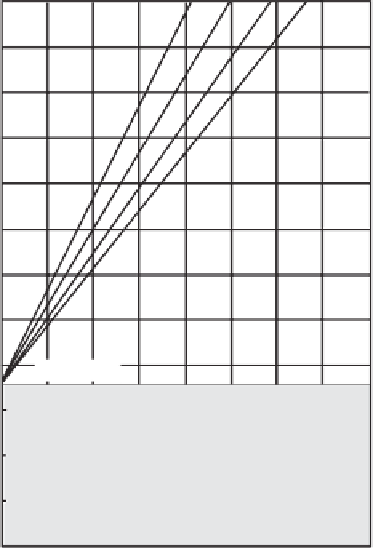
2.2.4.1 Mathematical Representation of Shrinkage
Curve
Figure 2.20 shows a collection of shrinkage curves for soils
of differing plasticity and different initial states, namely,
(i) undisturbed, (ii) compacted near the plastic limit, or (iii)
slurry near the liquid limit. A hyperbolic mathematical form
captures the shape of the shrinkage curves. The following
equation was proposed by M.D. Fredlund et al. (2002a) for
the shrinkage curve:
B
D
Shrinkage limit
Gravimetric water content, %
a
sh
w
c
sh
1
1
/c
sh
e(
w
)
=
sh
+
(2.7)
Figure 2.17
Drying phenomenon showing relationship between
air-entry value and shrinkage limit of a soil (after Marinho, 1994).
b
c
sh


Search WWH ::

Custom Search