Environmental Engineering Reference
In-Depth Information
Table 8.3 Summary of Soil Types Analyzed for
Permeability Function
10
−
3
Experimental
Leong & Rahardjo (1997)
Prediction
10
−
4
USDA Textural Classification
Number of Samples
10
−
5
Clay
21
Clay silt
18
10
−
6
Silt
12
Silty sand
29
10
−
7
Sand
49
Sandy clay silt
17
10
−
8
Sandy silt
30
Silt
74
Silty clay
34
10
−
9
Silty clay
18
10
−
10
10
−
11
USDA textural classification. The textural categories along
with the number of data sets in each category are shown
in Table 8.3.
Soils in each textural category were first analyzed and
then all soils were combined to obtain overall average val-
ues for
q
. Each SWCC data set was first best fit to determine
the
a
f
,n
f
, and
m
f
parameters associated with the Fredlund
and Xing (1994) equation. Then the SWCC and the satu-
rated coefficient of permeability were used to best fit the
permeability data in accordance with the equation proposed
by Leong and Rahardjo (1997a). The best-fit analysis of
the permeability data allowed the calculation of the
q
soil
parameter.
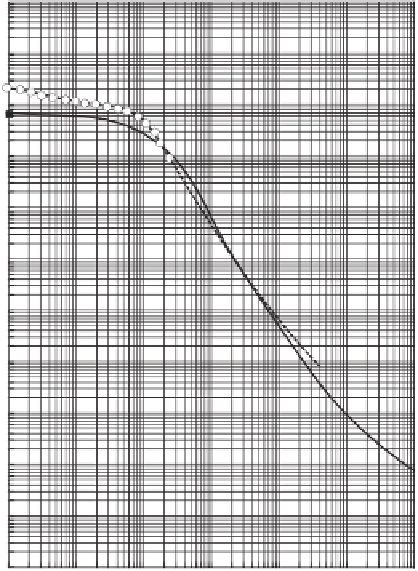
A typical best fit of the Leong and Rahardjo (1997) pro-
cedure for a sand soil is shown in Fig. 8.25. The best-fit
q
parameter for the sand was 2.54. A similar best fit for
silt is shown in Fig. 8.26 and the
q
parameter was 3.62.
Both plots illustrate that the predicted permeability function
quite closely fits the experimental data when an appropriate
q
parameter is selected for the permeability function.
Figure 8.27 shows the frequency distribution associated
with the
q
parameter when all soil textural categories are
combined (Fredlund et al., 2001a). The statistical analysis
of the
q
parameter is presented in Table 8.4. The results
show that the overall mean value for
q
is 3.29 and the stan-
dard deviation of
q
is 1.40. These values yield an overall
coefficient of variation of 43%, which is quite high. The
overall median value is 2.96 and the mode is 5.61.
Frequency distributions can be drawn for each of the soil
textural categories. The frequency distribution of
q
for sand
soil is shown in Fig. 8.28 and the frequency distribution of
q
for silt is shown in Fig. 8.29. Table 8.5 summarizes the
statistical properties for the computed
q
parameters for each
of the soil textural categories.
The standard deviation was 0.49 for the sand soil and 1.50
for the clay soil. The standard deviation was 0.84 for the
10
−
12
10
−
13
0.01
0.1
1
10
100
1000
10,000
Soil suction, kPa
Figure 8.25
Fit of proposed Leong and Rahardjo (1997a) perme-
ability function for experimental data on sand.
10
−
4
Experimental
Leong & Rahardjo (1997)
Prediction
10
−
5
10
−
6
10
−
7
10
−
8
10
−
9
10
−
10
10
−
11
10
−
12
10
−
13
10
−
14
10
−
15
0.01
0.1
1
10
100
1000
10,000
Soil suction, kPa
Figure 8.26
Fit of proposed Leong and Rahardjo (1997a) perme-
ability function for experimental data on silt.


Search WWH ::

Custom Search