Environmental Engineering Reference
In-Depth Information
40
20
Silt
30
15
10
20
5
10
0
0
q
q
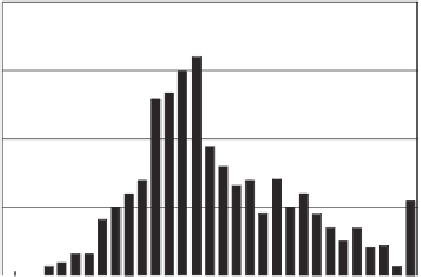
Figure 8.29
Frequency distribution for
q
permeability parameter
for silt soils analyzed (from Fredlund et al., 2001a).
Figure 8.27
Frequency distribution for
q
permeability parameter
for all soils analyzed (from Fredlund et al., 2001a).
20
Table 8.4 Statistical Analysis of
q
Soil
Parameter for All Soils
Sand
15
Statistical Variable
q
Soil Parameter
10
Mean
3.29
Standard error
0.08
Median
2.96
5
Mode
5.61
Standard deviation
1.40
Sample variance
1.96
0
Kurtosis
14.80
Skewness
2.35
q
Range
14.39
Figure 8.28
Frequency distribution for
q
permeability parameter
for sand soils analyzed (from Fredlund et al., 2001a).
Minimum
0.64
Maximum
15.03
Number of soils
323
sandy silt and 1.81 for the clayey silt. The results indicate
that there is less scatter in the fitting parameter
q
as the soil
becomes closer to a sand material. The fitting parameter
q
tends toward 1.0 for sand soils.
The sand showed a mean
q
value of 2.37 while the clay
soils showed a mean
q
value of 4.34. The sandy silt showed
a mean
q
value of 2.86 and the clay silt showed a mean
q
value of 3.58. The results indicate a trend toward a larger
q
value for soils with higher plasticity and a wider distri-
bution of particle sizes. The mean fitting parameters for all
soil types ranged from 2.4 to 5.6. The statistical results pro-
vide a general indication of the range and scatter that can
be anticipated when using the Leong and Rahardjo (1997a)
equation (i.e., Eq. 8.29) for estimation of the permeability
function for an unsaturated soil.
The analysis of an even larger database of measured
SWCC and permeability function measurements would
be useful
associated with the
q
parameter. However, it must also be
recognized that there will always be considerable scatter
in the
q
parameter. The estimation procedure proposed by
Leong and Rahardjo (1997a) is of value, but it does not
appear to provide a singular value for the
q
parameter.
8.2.9 Regression Techniques for Best-Fit Permeability
Function
Gardner (1958a) published two empirical forms for a per-
meability equation. The first equation was presented earlier
and takes the following form:
k
w
u
a
−
u
w
=
k
s
a
g
u
a
−
u
w
ρ
w
g
n
g
(8.30)
1
+
to better understand the mean and variation


Search WWH ::

Custom Search