Environmental Engineering Reference
In-Depth Information
50
θ
s
= 0.45
40
30
20
H
= 100 mm
H
= 300 mm
H
= 600 mm
H
= 800 mm
10
0
10
6
10
6
10
6
0
500,000
1.5
×
2
×
Time,
t
(s)
(a)
50
θ
s
= 0.39
40
30
20
10
H
= 100 mm
H
= 300 mm
H
= 600 mm
0
1.2
×
10
6
1.5
×
10
6
0
300,000
600,000
900,000
Time,
t
(s)
(b)
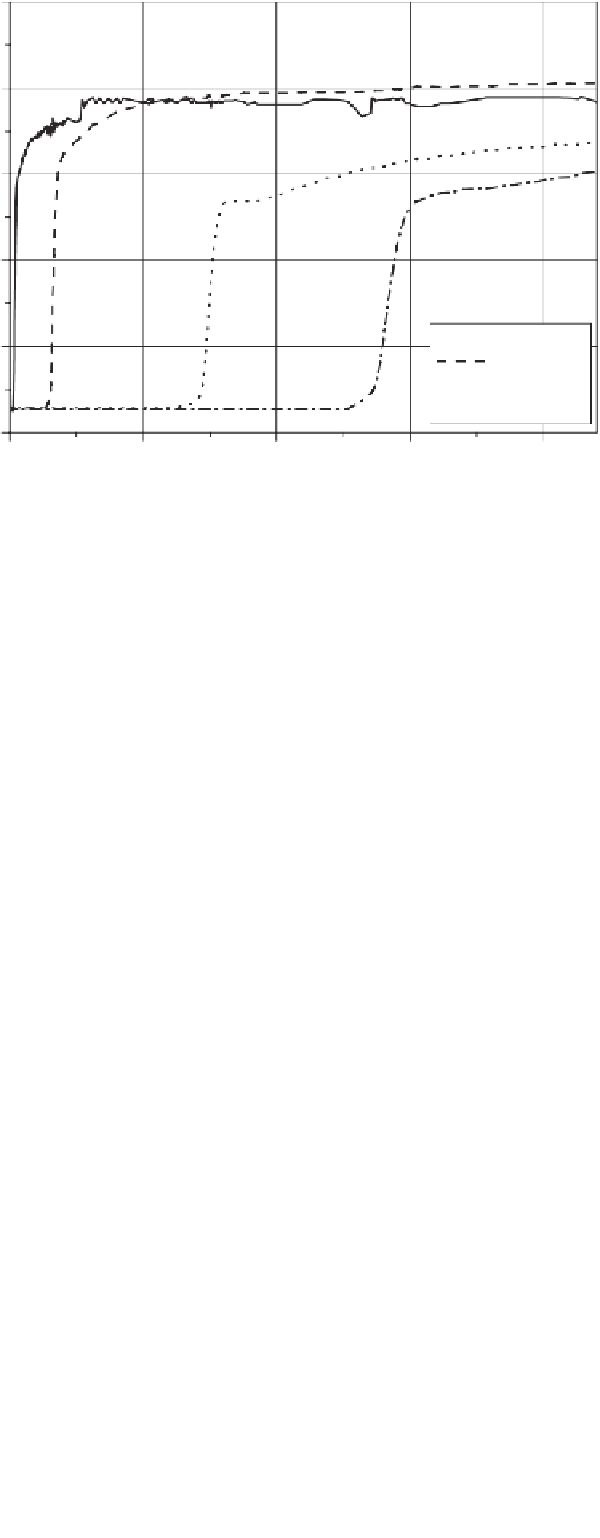
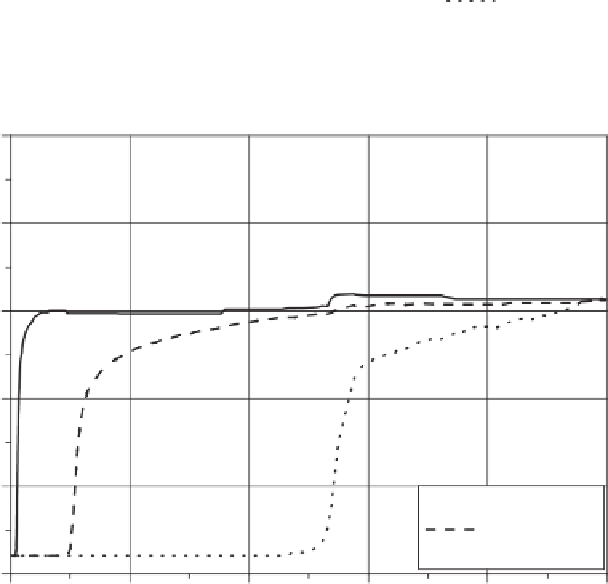
Figure 7.47
Water content measurements during capillary rise process: (a) monitored water
content profiles at various sections of ML soil; (b) monitored water content profiles at various
sections of SC soil (Li et al., 2009).
The hydraulic gradient would decrease to a low value.
Therefore, the water content in the wetted soil could only
increase slowly as it approached steady-state water contents.
The water contents in the wetted zone corresponded to the
degrees of saturation of about 80% for CL with sand and
sandy ML, about 75% for SM with gravel, and about 40%
for SC with gravel.
Tensiometers were inserted into the side of the soil col-
umn after the wetting front passed through the respective
sections. The monitored suctions were relatively stable and
decreased slowly with time. One of the monitored suction
profiles is shown in Fig. 7.48, where suctions decreased
with time and approached a steady-state condition. At the
100-mm-high section, matric suction decreased to a constant


Search WWH ::

Custom Search