Environmental Engineering Reference
In-Depth Information
1000
800
600
400
GW-GM
SM
SC
ML
CL
200
0
10
6
10
6
10
6
10
6
0
500,000
1.5
2
2.5
×
×
×
Time (
t
), s
(a)
0.1
GW-GM
SM
SC
ML
CL
Best fit curve
0.01
0.001
0.0001
10
6
1000
10,000
100,000
Time (
t
), s
(b)
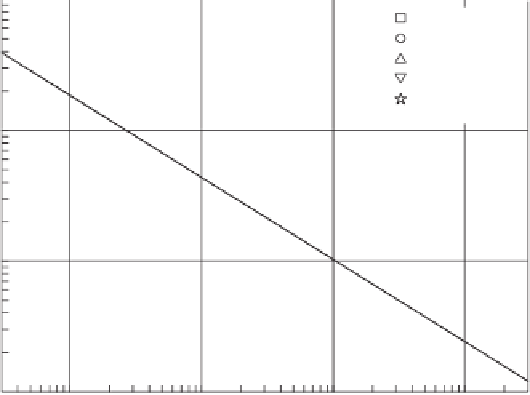
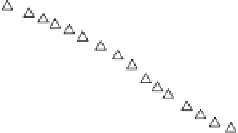
Figure 7.46
Capillary rise process for several soils: (a) wetting-front height recorded over time;
(b) wetting-front velocity on a log-log scale (after Li et al., 2009).
the time for an experiment in a soil column 400mm high
is about 3-6 days. The time for the experiment for a soil
column 600mm high is about 7-14 days while the time for
an experiment for a soil column 800mm high will increase
to 15-30 days.
The water content changes at heights of 100, 300, 600, and
800mm were monitored during the experiments. The water
content changes for two of the soils are shown in Fig. 7.47.
The water contents in the soil columns show three distinct
stages: the initial stage, the wetting stage, and the wetted
stage.
In the initial stage, before the wetting front reached a partic-
ular section, the water content in the section remained equal
to the initial water content corresponding to placement con-
ditions. Since the soil was initially oven dried and had a low
water content (and an extremely low coefficient of perme-
ability), the hydraulic gradient in the soil was approximately
1.0 (i.e., the gradient was controlled by elevation change).
During the wetting stage, after the wetting front reached a
particular section, the suctions in the wetted soil decreased
rapidly and large hydraulic gradients were present. There-
fore, water was able to rapidly enter the initially dried soil
and the water content quickly increased.
During the wetted stage, after the soil at a particular
section was wetted, the suction at that section would change
to a similar value as found at a lower adjacent section.


Search WWH ::

Custom Search