Environmental Engineering Reference
In-Depth Information
The method depends on being able to discern the move-
ment of the wetting front. Therefore, it is important to start
with the soil in a dry state and the soils need to show a dis-
tinct change in color when wetted. It should be noted that
the wetting front in clays may not be discernible.
Section A, column top
Drier soil
h
A
F
2
, Wetting front at
t
2
F
1
, Wetting front at
t
1
7.6.4.2 Presentation of Results from Capillary Rise
Column Tests
The capillary rise processes in the column tests for five soils
tested are presented in Fig. 7.46a. The wetting front in the
GW-GM with sand rose to a height of 113mm above the
water table and remained constant. The wetting-front advanc-
ing velocity at a height of 113mm became extremely slow.
The results showed that the unsaturated coefficient of perme-
ability above that section was extremely low. The GW-GM
with sand contained 35% sand, 58% gravel, and 7% fines.
The GW-GM with sand contained large particles that formed
a structure with numerous macropores. The macropores in the
soil were filled with air and few capillary flow channels were
available above a height of 113mm for water flow. The corre-
sponding soil suction was 1.1 kPa at steady-state conditions.
The wetting-front advancing process for the other four
soils (i.e., SC with gravel, SM with gravel, sandy ML, and
CL with sand) showed similar behavior when capillary water
rose to the top of the soil column (i.e., 700-1000 mm). It
took 2-4 weeks for water to rise in these columns. The fines
content in these four soils was larger than 24% and numer-
ous micropores were formed that filled with water under
low soil suctions (i.e., smaller than 100 kPa in the capillary
rise process). There was an abundance of continuous-flow
channels for the capillary rise process.
The wetting-front advancing velocity (see Fig. 7.46b) gen-
erally increased as the fines content increased. In particular,
the advancing velocity in the GW-GM with sand was much
slower (i.e., about
Δ
h
Section B
monitoring section
Wetted soil
h
B
h
Column bottom
H
= 0
Time =
t
1
Time =
t
2
(a)
v
=
Δ
h
/
Δ
t
h
Δ
Δ
t
Time,
t
5
-
10
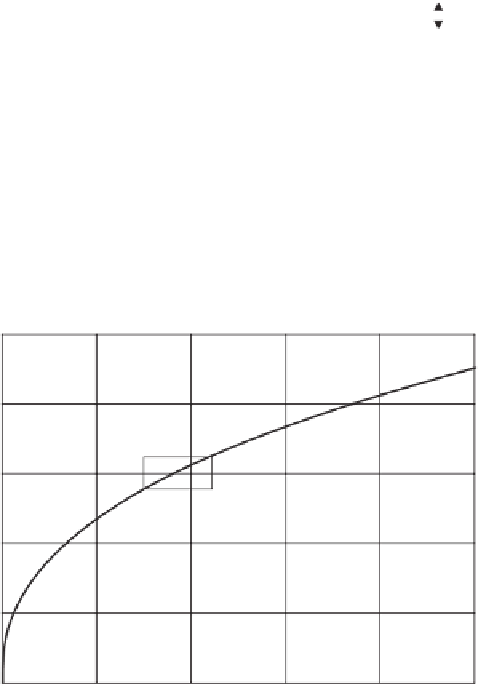
the rate) in the four finer soils. The
wetting-front advancing velocity shows a loglinear relation-
ship with time as described by the following equation:
1
(b)
Figure 7.45
Water capillary rise process in initially air-dried soil
column: (a) soil column at two elapsed times during capillary rise;
(b) height of wetting fronts,
h
, recorded with elapsed time
t
(after
Li et al., 2009).
log
v
=
a
+
λ
log
t
(7.87)
where:
Using
v
instead of
h
, Eq. 7.84 becomes
λ
=−
0.63 and
θ
h
B
,t
2
+
θ
h
B
,t
1
−
2
θ
i
γ
w
v
2
t
2
−
t
1
a
=
0.18 for the four finer soils (when using units of
mm/s with reference to Fig. 7.46b).
k
w
=
2
ψ
h
B
,t
1
−
ψ
h
B
,t
2
−
γ
w
v
t
2
−
t
1
(7.86)
Based on Eq. 7.87, the rising height of the wetting front,
h
,is
The calculated coefficient of permeability
k
w
corresponds
to a mean suction value (i.e., 0.5[
ψ(h
B
,t
1
)
ψ(h
B
,t
2
)
]).
The monitored data at one section along with the wetting-
front advancing velocity is required to calculate a series of
unsaturated coefficients of permeability. It is not necessary
to have a series of measurement sections (as is the case
in the instantaneous profile method); however, each section
allows for the calculation of the unsaturated coefficient of
permeability.
+
10
a
t
λ
+
1
/ (λ
h
=
+
1
)
(7.88)
According to Eq. 7.82, if the column length is doubled,
the time needed for the wetting front to reach the column top
will be 2
1
/(λ
+
1
)
times longer (i.e., 6.5 times as long when
λ
=−
0.63). Consequently, the column length influences the
time required for the experiment. Figure 7.46a shows that


Search WWH ::

Custom Search