Environmental Engineering Reference
In-Depth Information
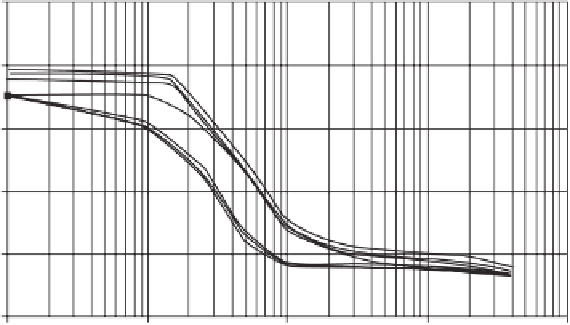
25
Specimen 1
Specimen 2
Specimen 3
Air-entry value = 2 kPa
20
15
10
Residual suction = 13 kPa
5
0
0.1
1
10
Soil suction (kPa)
100
1000
Figure 5.42
Measured drying and wetting SWCCs on Beaver Creek sand (from Pham, 2002).
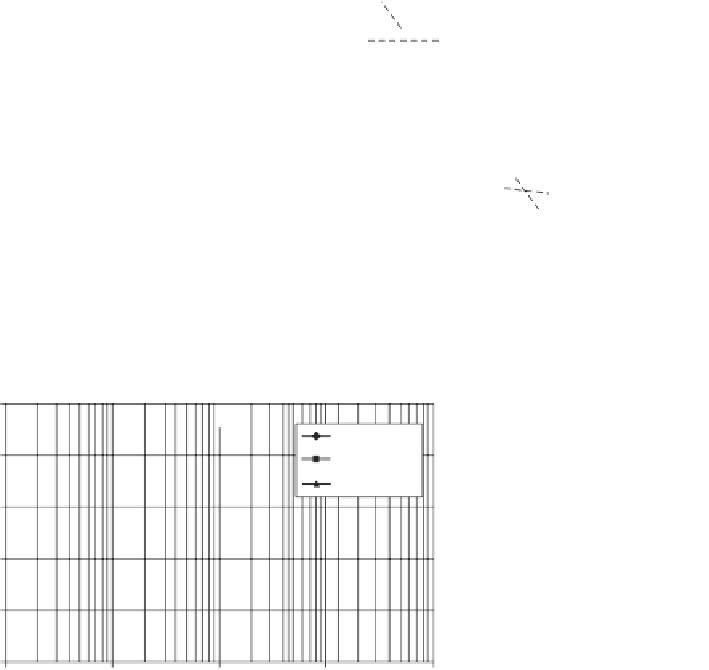
25
Section B
Section M
Section T
Air-entry value = 10 kPa
0.4
Specimen 1
Specimen 2
Specimen 3
20
0.3
III-D
III-D
III-W
III-W
15
IV&V-D
IV&V-D
Residual
suction = 120 kPa
0.2
III-D
III-W
I&II-D
I
V&V-D
I
&II-D
0.1
10
IV&V-W
IV&V-W
IV&V-W
I&
I
I
-D
0.0
5
1
10
1
10
1
10
Matric suction,
u
a
−
u
w
(kPa)
0
0.1
Figure 5.44
SWCCs defined from independent water content and
matric suction measurements during wetting and drying model sim-
ulations (after Tami et al., 2004b, 2004c).
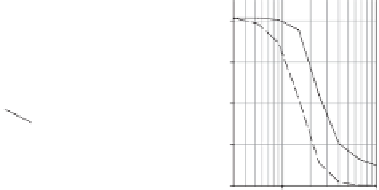
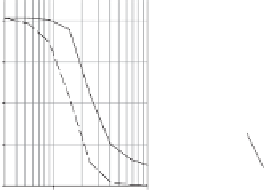
1
10
Soil suction (kPa)
100
1000
Figure 5.43
Measured drying and wetting SWCCs on processed
silt (from Pham, 2002).
suctions were measured using tensiometers. The SWCC for
each of the soils was independently measured in the labora-
tory. Figure 5.44 presents some of the model test results and
clearly indicates that the SWCC relationships independently
measured in the laboratory provided a reasonable represen-
tation of the water content versus matric suction bounding
curves followed under in situ drying and wetting conditions
(Tami et al., 2004b).
Table 5.3 Approximate Shift between Drying and
Wetting SWCCs
Range of Shift at
Approximate
Inflection Point
Average Shift as
as Ratio of
Percentage of
Soil Type
Log Cycle
Log Cycle
5.5.2 Initialization of Stress State in SWCC Test
The suction in a soil specimen is released to zero at the start of
a SWCC test. Soil specimens can be placed within a confining
ring and given access to water. The water can be imbibed from
the bottom of the specimen or given excess water from the top
of the specimen. It is preferable to wet the specimen from the
bottom. In thisway air is not as likely to be entrapped in the soil
specimen. The soil specimen is usually allowed one or more
days to take on as much water as possible. The soil specimen
should be covered with metallic foil during the equalization
process to prevent loss of moisture by evaporation.
The soil specimen is usually 20-30mm in thickness. The
prepared soil specimen might also be placed into a pressure
Sand
0.15-0.35
25%
Silt
0.35-0.60
50%
Clay
0.60 to
>
1
.
0
Highly variable
in large-scale laboratory and field tests. Tami et al., (2004b,
c) constructed and instrumented a 2-m long model of a slope
consisting of two cohesionless soils. The experiment was
undertaken to study the performance of capillary barriers
on slopes. A flux boundary condition was imposed while
water contents were measured using TDR devices and matric


Search WWH ::

Custom Search