Environmental Engineering Reference
In-Depth Information
60
50
Drying scanning
curve
40
Initial stress state from
soil could dry or wet
30
Wetting or adsorption
(bounding) curve
Drying or desorption
(bounding) curve
20
Wetting scanning
curve
10
0
10
6
0.1
1
10
100
1000
10,000
100,000
Soil suction, kPa
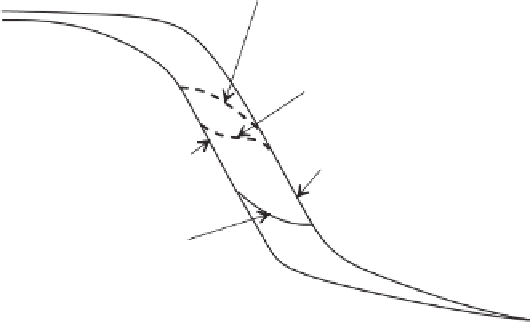
Figure 5.40
Wetting and drying scanning curves and designation of initial stress state.
θ
Entrapped air
Initial drying curve
θ
s
Main (boundary) drying curve
Primary (first-order)
drying scanning curve
Second-order
wetting scanning curve
Primary (first-order)
wetting scanning curve
Main (boundary)
wetting curve
θ
u
θ
1
θ
2
θ
3
θ
min
θ
0
Ψ
1
Ψ
2
Ψ
3
Ψ
max
Soil suction, kPa
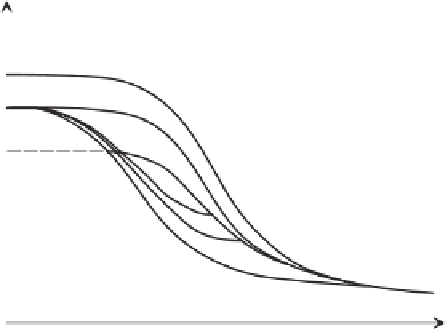
Figure 5.41
Bounding and scanning curves used to define drying and wetting of unsaturated
soil (after Pham et al., 2003a).
Desorption curves are the easiest SWCC to measure in the
laboratory and, consequently, are most commonly measured.
Desorption and adsorption curves have, however, been mea-
sured on numerous soil types. Pham et al., (2002) mea-
sured drying and wetting curves on sand (Fig. 5.42) and silt
(Fig. 5.43). Three specimens were tested in each case and
the results were found to be reproducible and consistent.
The air-entry value for the sand specimen was 2 kPa and
the residual suction was 13 kPa. The air-entry value for the
silt was 10 kPa and the residual suction was 120 kPa.
Pham et al., (2002, 2003a, b) analyzed the drying and
wetting curves for 34 data sets on a variety of soils reported
in the literature. The difference between the hysteresis loops
at the inflection points was used as the primary indicator of
the magnitude of hysteresis.
The bounding drying curve tends to be approximately con-
gruent (i.e., parallel on a semilog plot) to the bounding wetting
curves. Table 5.3 shows that the distance between themaindry-
ing and wetting curves varied between 0.15 and 0.35 of a log
cycle for sands. The bounding curve spacing for more well-
graded silt soils varied between 0.35 and 0.60 of a log cycle. It
was suggested that the approximate spacing between the dry-
ing and wetting SWCCs could be assumed to be 25% of a log
cycle for sands and 50% of a log cycle for well-graded silts.
Hysteretic behavior observed in the laboratory while per-
forming wetting and drying SWCCs has also been observed


Search WWH ::

Custom Search