Geology Reference
In-Depth Information
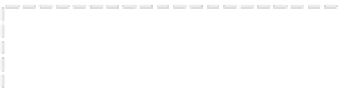
Field runoff area
Fig. 13.3
Relationship between
gross buffer area (element
configuration 1 in text) and
effective buffer area (element
configuration 2 in text) (after
Dosskey
et al
., 2002).
Effective area
Gross
area
Model elements
Table 13.5
Model results for element configurations 1 and 2.
Predicted deposition in buffer (kg m
−2
)
Measured deposition
in buffer (kg m
−2
)
Site
Element configuration 1
Element configuration 2
1
3.1
1.83
3.65
2
10.25
0.79
7.78
Note
: The measured values of deposition differ from those given in Table 13.1 because they have
been corrected for the effective buffer width.
tion used for the study area. For each site the
model was set up to run with only two elements,
comprising the field above the buffer and the
buffer strip respectively. This approach, however,
assumes that all the runoff from the field enters
the buffer uniformly across the slope. Since field
observations showed that this was not the case
and that runoff concentrated in local depressions
and approached the buffer in a single or a limited
number of flow paths, an alternative approach was
also tried, taking account of the effective area of
the buffer strip. This was determined by examining
the presence of sediment deposition within the
buffer. These observations indicated that in the
first field, only 50% of the buffer was likely to
receive sediment and for the second field, only
10%. The difference between the two approaches
is illustrated in Fig. 13.3 (Dosskey
et al
., 2002).
Although the model predicts the runoff and
soil loss leaving each field below the buffer, these
cannot be used to indicate whether the model
gives reasonable results since neither was
measured in the field. The field data are only for
deposition of sediment within the buffer. The
model output can, however, be used to calculate
this by comparing the value of the soil loss from
the slope element above the buffer with that
below the buffer. The difference between the two
represents either net erosion or deposition within
the buffer. The predicted and measured values of
deposition for the two element configurations are
shown in Table 13.5, from which it is clear that
using the effective buffer strip area improves
the predictions. However, even with the second
approach, the model still underpredicts the
amount of sediment deposited within the buffer.