Geology Reference
In-Depth Information
0.4
400
0.4
400
0.2
200
0.2
200
0
0
0
0
300
900
300
900
0.5
1
0.5
1
XL (m)
XL (m)
ThMX (% POR)
ThMX (% POR)
0.4
400
0.4
400
0.2
200
0.2
200
0
0
0
0
0.01
0.035
1
30
1
30
0.01
0.035
Mann(IR) (m
1/6
)
Mann(IR) (m
1/6
)
RFR (cm m
-1
)
RFR (cm m
-1
)
0.4
400
0.4
400
0.2
200
0.2
200
0
0
0
0
20
250
20
250
0.1
1
0.1
1
FMIN (mm h
-1
)
FMIN (mm h
-1
)
D50 (
µ
m)
D50 (
µ
m)
0.4
400
400
0.4
0.2
200
200
0.2
0
0
0
0
0.1
1000
0.1
1000
0.1
5
0.1
5
G (mm)
G (mm)
EROD (g J
-1
)
EROD (g J
-1
)
400
400
0.4
0.4
200
200
0.2
0.2
0
0
0
0
0.3
0.6
10
50
10
50
0.3
0.6
COH (kPA)
COH (kPA)
POR (% v v
-1
)
POR (% v v
-1
)
400
0.4
200
0.2
0
0
0.1
1
0.1
1
Thl (% ThMX)
Thl (% ThMX)
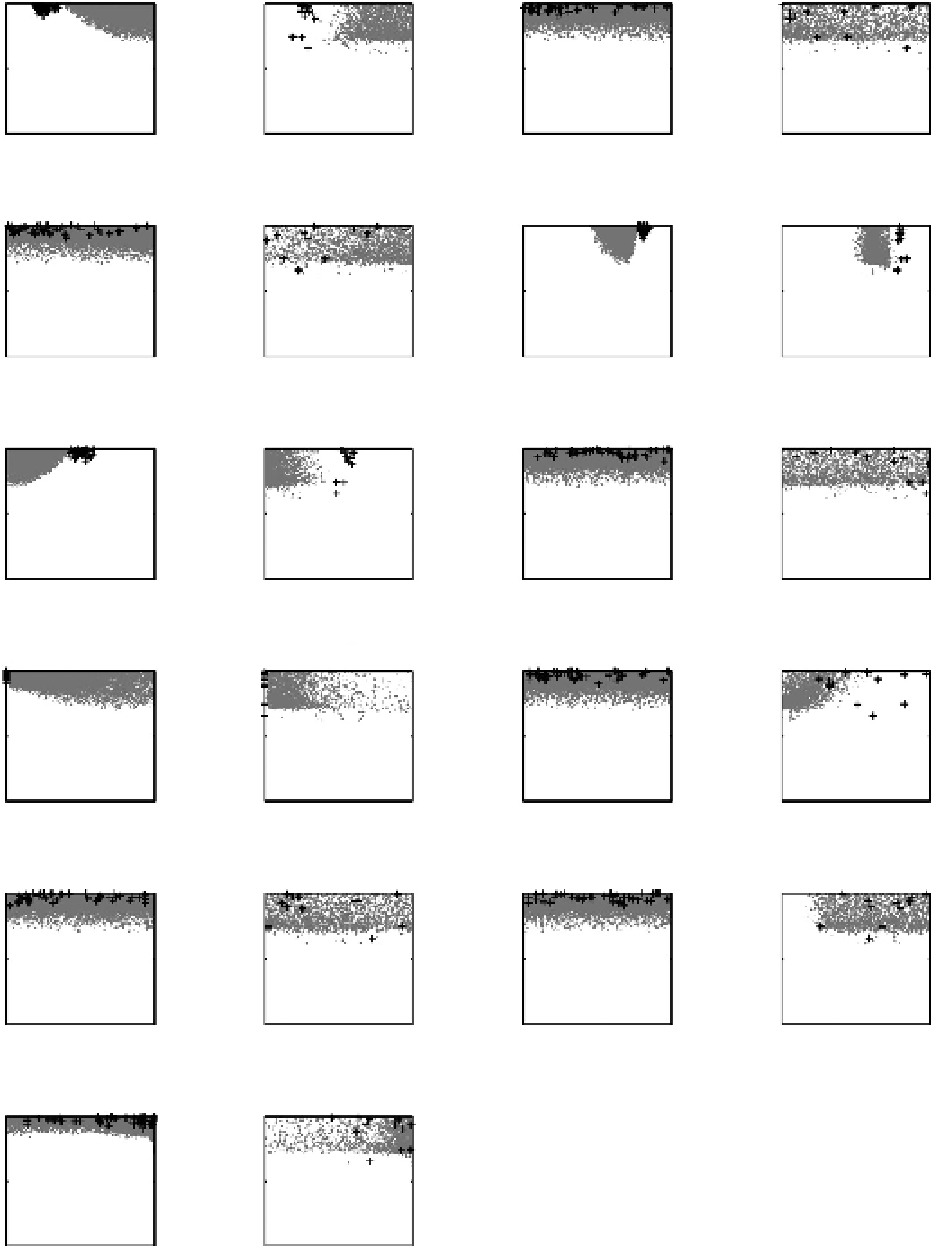
Fig. 5.6
Dotty plots of simulation performance for the parameters varied in this study. The grey dots denote the
17 November 06 event and the black crosses the 2 February 07 event. The parameter sets are those retained based
on the 0.4
Q
performance threshold applied to both events separately.