Biomedical Engineering Reference
In-Depth Information
a
b
c
2
1
d
e
f
g
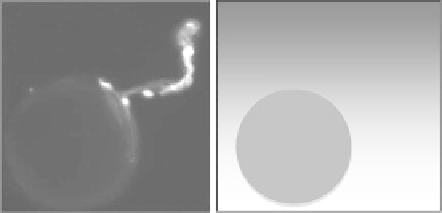
Fig. 8 Sprout pathfinding in different linear VEGF gradients. a Fluorescent images of sprout
pathfinding are analyzed by quantifying b the initial (h
1
) and final (h
2
) angles of sprout growth with
respect to the gradient. c The growth angle is binned into six angular regions, colored as described
by the pinwheel. An angle of 0 is completely aligned with the gradient, and an angle of 180 means
the sprout is growing anti-parallel to the gradient. Distributions are shown for d, e initial and
f, g final angles of sprouts grown in matrices of d, f 1.2 mg/mL and e, g 1.9 mg/mL collagen. Three
VEGF concentration profiles are shown. Increased alignment with the gradient between initial and
final angles indicates sprout pathfinding. For each condition, n = 4 microdevices, with an average
of 80 sprouts. Originally published in [
70
]
extent of lumen formation was quantified by determining the fraction of the sprout
length with a hollow core (Fig.
9
c) [
69
]. As an additional measure of sprout
maturation, cell density within the sprout was quantified as the number of cell
nuclei found within a 10 lm length of the sprout. It is hypothesized that a higher
cellular density is more likely to support lumen formation. Both markers of
maturity are significantly increased in the 1.9 mg/mL collagen matrix compared to


Search WWH ::

Custom Search