Agriculture Reference
In-Depth Information
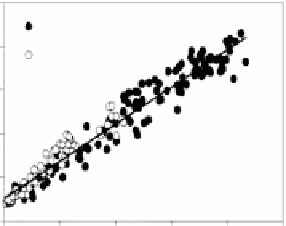
Fig. 6.9
Estimation of
canopy chlorophyll for a
maize- and a soybean crop by
a red edge index (From
Gitelson et al.
2005
, altered)
2.0
maize
soybean
1.6
1.2
0.8
r
2
= 0.95
0.4
y = 0.3418 x + 0.2075
0.0
0
1
2
3
4
canopy chlorophyll in g per m
2
The logical consequence for recording the GPP is that at first information about
the canopy chlorophyll is obtained via a suitable reflectance index. Secondly, by
multiplying the canopy chlorophyll with the
photosynthetically active radiation
(PAR)
, the gross primary productivity is estimated (Peng et al.
2010
). The first step
requires a suitable reflectance sensing technique,
e.g.
using the green- or the red
edge chlorophyll index (Fig.
6.9
). Among these, a red edge index (formula:
R
NIR
/
R
720-730
− 1
) offers the perspective of a non-species specific use.
However, the use of the photosynthetically active radiation (PAR) as a
multipli-
cator
for the canopy chlorophyll inherently means that a temporally varying factor
is involved. The canopy chlorophyll too changes during the growing season, but the
PAR varies much more, namely diurnally and in addition with the weather. Frequent
records and averaging would have to compensate for this.
A simpler approach is to use the canopy chlorophyll that is sensed by a green- or
red edge index as a
direct proxy
of the gross primary productivity without multi-
plying it by the photosynthetically active radiation (Gitelson et al.
2008
; Peng et al.
2010
,
2011
). Because the actual values of the chlorophyll indices already result
from an interaction between the canopy chlorophyll and the radiation. So without
any multiplication with the PAR, the effect of the radiation might be sufficiently
included. Consequently, a simplified process of estimating the gross primary pro-
ductivity seems viable. The path of its short sensing logic is:
Chlorophyll index
Canopy chlorophyll
Gross prim. productivity
.
This procedure eliminates the short-term variations that might come from the
multiplication with the PAR. However, the focus is on the results that can be obtained.
Sensed results were compared with data that were obtained via a so called “eddy
covariance system” (Fig.
6.10
). This method analyses the carbon dioxide fluxes
around defined areas in the field and thus obtains information about the carbon fixa-
tion by the crop. The chlorophyll sensor was located on a vehicle, hence the results are
based on proximal site-specific sensing. Yet similarly reliable information about the
gross primary productivity can also be obtained with remote sensing techniques.
Figure
6.11
shows the relation between a green chlorophyll index from satellite data
and the gross primary productivity of maize derived from it. The carbon dioxide fluxes
in the respective areas within the field again allowed the needed comparisons.