Agriculture Reference
In-Depth Information
35
28
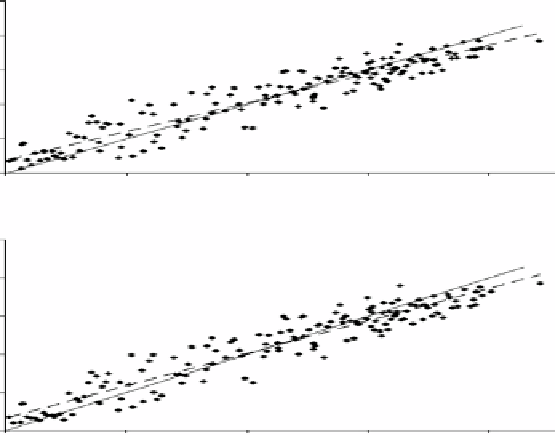
green chlorophyll index
21
14
r
2
= 0.89
y = 0.83x + 2.67
7
0
0
7
14
21
28
gross prim. product. from carbon fixation in g carbon / ( m
2
x d )
35
red edge chlorophyll index
28
21
r
2
= 0.90
14
y = 0.85x + 2.29
7
0
0
7
14
21
28
gross prim. product. from carbon fixation in g carbon / ( m
2
x d )
Fig. 6.10
Comparing the daytime gross primary productivity of maize that was either proximal
sensed by chlorophyll indices or measured via fixation of CO
2
fluxes in the field. For details to the
chlorophyll indices see Fig.
6.8
and text to it. The results refer to 16 irrigated and rainfed maize
fields within the years 2001-2008 in Nebraska, USA (From Peng et al.
2011
)
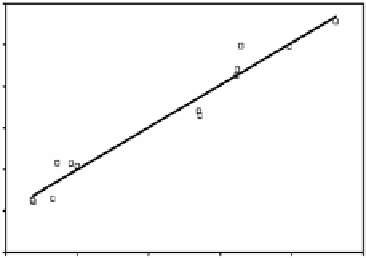
Fig. 6.11
Synoptic
monitoring of gross primary
productivity of maize using
a green chlorophyll index
based on Landsat data (From
Gitelson et al.
2008
, altered)
based on remote sensing
via Landsat- 7 ETM +
10
8
6
4
r
2
= 0.96
2
y = 3.3494 x + 1.9519
0
0 5 10 15 20
measured gross pr. prod. in g carbon / m
2
x d
A prerequisite for productivity sensing from satellites is a
clear sky
. So depending
on the respective climate, there may be temporal restrictions. And proximal sensing
always facilitates high resolutions. However, the Landsat Thematic Mapper Plus satel-
lite system - on which the comparison in Fig.
6.11
is based - also can provide a spatial
resolution of 30 × 30 m. This probably suffices for most site-speciic farm operations.