Geology Reference
In-Depth Information
Basic concepts in this section include: oxygen iso-
topes in ice provide information on atmospheric tempera-
ture fluctuations—lower delta
ls
O values (written S
ls
O)
indicate lower temperatures; cold glaciers, well below
the melting point, are required for extraction of annual
records—any melting mixes the annual signal; with
increasing altitude atmospheric temperatures decrease—
if ice cap melting now occurs where it did not in the past,
the atmosphere has warmed; and, retreat of valley or
outlet glaciers is due to warmer temperatures or less
accumulation of snow and ice to replenish the glacier.
Worldwide, almost all mountain glaciers are retreating
due to increased atmospheric temperatures. In the recent
past, a few glaciers were advancing because the warmer
air temperatures have produced more snow.
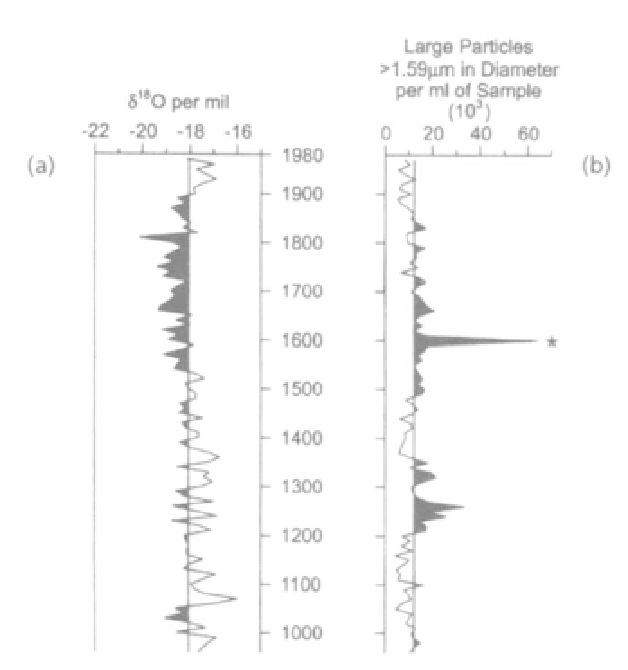
b. How could the record of the Huaynaputina volcanic
eruption be used to date this ice core (Figure 18.1b)?
2.
During this period, would you expect mountain glaciers in
the region to have advanced (due to less summer melting) or
retreated (due to more summer melting)? Explain.
3.
From the record in 18.1a, has the last century at Quelccaya
been warmer or cooler than the three centuries before 1900?
QUESTIONS 18, PART A
1.
Study Figure 18.1a, the oxygen isotope record for the
Quelccaya Ice Cap in Peru. This ice cap is fed by moisture
from the Amazon Basin.
a.
Were temperatures warmer or colder than the mean for
the record during the period from A.D. 1550 to 1900?
4. Between 1963 and 1991, significant retreat and lowering of
an outlet glacier of the Quelccaya Ice Cap was observed.
Although glaciers may not respond immediately to climate
change, if increased temperature was the cause of this
retreat, is this explanation consistent with temperature data
in Figure 18.1a? Why or why not?
5.
In 1600 the Rhone Glacier in Switzerland was in an
advanced position. A four-story building, erected about
1950, now covers the glacier's former terminal position.
Does this evidence agree or disagree with the ice core record
in Figure 18.1a?
6.
In parts of Glacier Bay, near Juneau, Alaska, glacier ice was
near its maximum in 1820. Since that time, the ice has
retreated more than 45 miles in this fiord. Does this Little Ice
Age (about 1450 to 1850) advance of ice in Glacier Bay, and
the retreat that followed, agree with the ice-core record from
Peru (18.1)? Explain.
7. Study Figure 18.2 A, B, C, D, and E. This figure presents
the oxygen isotope profiles for the tropical Quelccaya Ice
Cap drilled in 1991 on the summit dome (A) and cores
drilled in 1976 on the summit dome (B), the middle dome
(C), and the south dome (D). The north-to-south cross sec-
tion of the Quelccaya Ice Cap (E) illustrates the locations
from which the oxygen isotope records in A through D were
drilled and the position of the percolation line in 1976 and
1991. The percolation line is the altitude on the glacier below
which melting of snow and subsequent percolation of water
through the snow and firn occurs.
FIGURE 18.1
Oxygen isotope (a) and particle record (b) from
the 1983 Quelccaya, Peru, ice core. More negative
S
18
0 values
(per mil) indicate cooler temperatures during precipitation.
Mean values in a and b given by vertical lines. Wind blown or
volcanic dust-particle concentrations are given as number of
particles per milliliter of sample. The Huaynaputina, Peru, volcanic
eruption is indicated by *.
(Modified from L. Thompson et al, 1986; L. Thompson, pers.
comm. 1991, 2008; used with permission)