Geology Reference
In-Depth Information
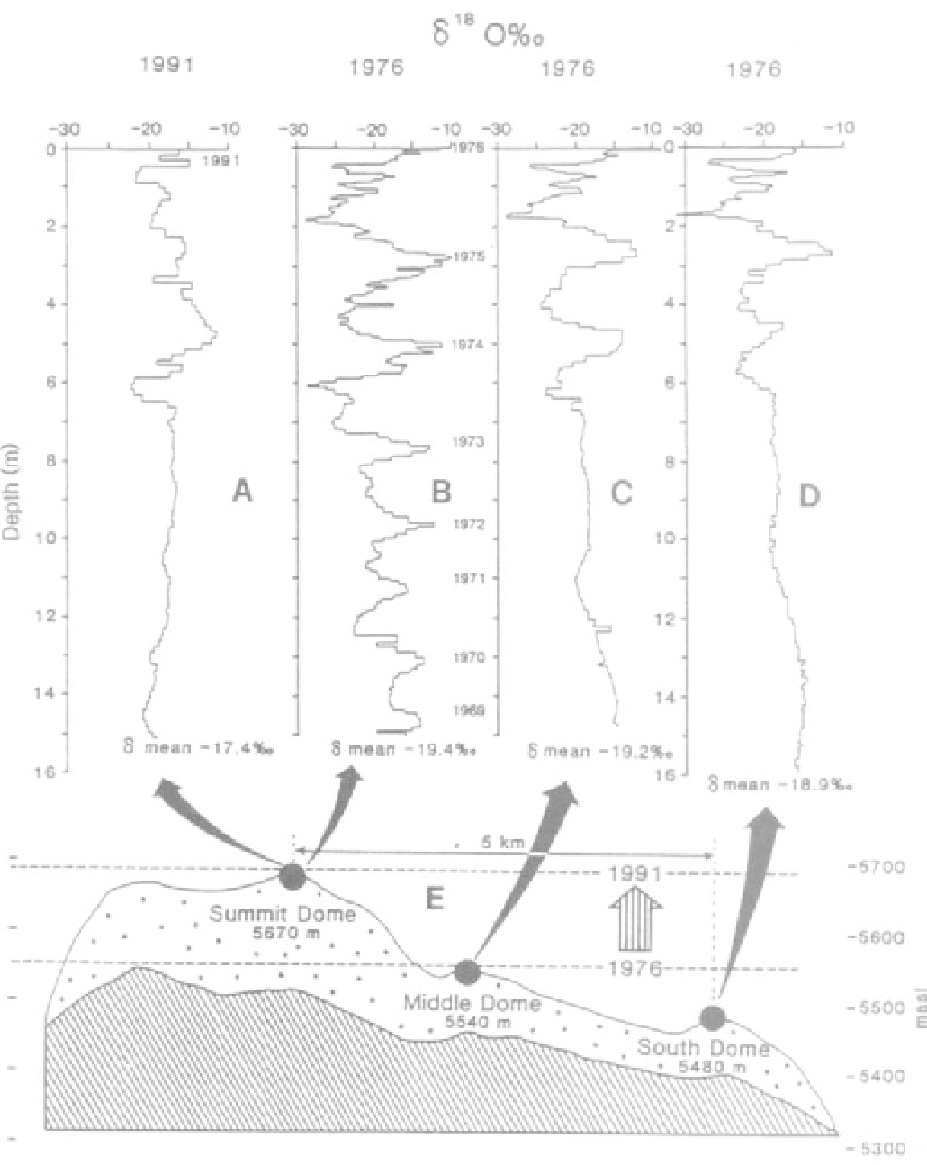
FIGURE 18.2
Oxygen isotope profiles (A to D) and north-south cross section (E) for the Quelccaya Ice Cap, Peru. Records A and B are
from Summit Dome; C is from Middle Dome and D is from South Dome. Dashed lines are the altitudes (meters above sea level, masl)
for the percolation or melting line.
(Modified from L. Thompson, pers. comm., 1991, 2008; used with permission)
a.
How do the mean isotopic values at the summit core
drilled in 1991 compare with those drilled in 1976? (See
mean values at bottom of each record)
c.
Why are the distinctive annual spikes seen in the 1976
summit core missing or subdued in the 1991 summit
core? (Hint: Compare 1991 summit record with the record
from South Dome.)
b.
What does the change in mean isotopic value between
1976 and 1991 at Summit Dome suggest about atmos-
pheric temperatures in this part of the World?
8.
In 1991 the percolation line was above the Summit Dome
(Figure 18.2E). How many meters has the percolation line
risen between 1976 and 1991?