Databases Reference
In-Depth Information
Isn't that great? How do I figure out something like that? Well, here is how
it's supposed to work:
1. During a
CALC ALL
database calculation, Essbase will calculate your
dimension tagged as
Accounts
first.
2. Next will be the dimension you have tagged as
Time
.
3. Then, Essbase will calculate the remaining
Dense
dimensions in the order
they appear in the EAS outline viewer (top to bottom).
4. Finally, Essbase will calculate the remaining
Sparse
dimensions again,
in the order they appear in the EAS outline viewer (top to bottom).
5. If you do not have a
Time
dimension or an
Accounts
dimension, Essbase
seems to calculate the
Dense
Dimension
(top to bottom) first.
6. Then, Essbase will finish up with the
Sparse
dimensions (top to bottom).
Now, within each dimension, the order of calculation is supposed to work like this:
1.
First, consolidations are performed as per the
Member Properties
settings
(formulas and rollups) for the level zero members of all of the branches in
the dimension currently being calculated.
2.
The calculations continue rolling up the data to
Level 1
, then to
Level 2
,
and so on, until the entire dimension has been calculated.
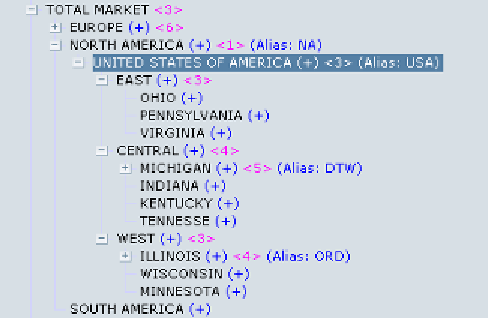
Notice the different levels in the
TOTAL MARKET
dimension in the preceding
screenshot. On expanding the
UNITED STATES OF AMERICA
market, you see
the lowest or zero level members appear to be states. Then, next up are regions,
and finally the United States market itself. When we talk of rolling up data, this is
what we mean. The database outline is set up so the states add up into the regions
and the regions add upto the market.