Geoscience Reference
In-Depth Information
> 5.00 m
3.00 m - 5.00 m
2.00 m - 3.00 m
1.00 m - 2.00 m
0.50 m - 1.00 m
0.25 m - 0.50 m
-0.25 m - 0.25 m
-0.50 m - -0.25 m
-1.00 m - -0.50 m
-2.00 m - -1.00 m
-3.00 m - -2.00 m
-5.00 m - -3.00 m
< -5.00 m
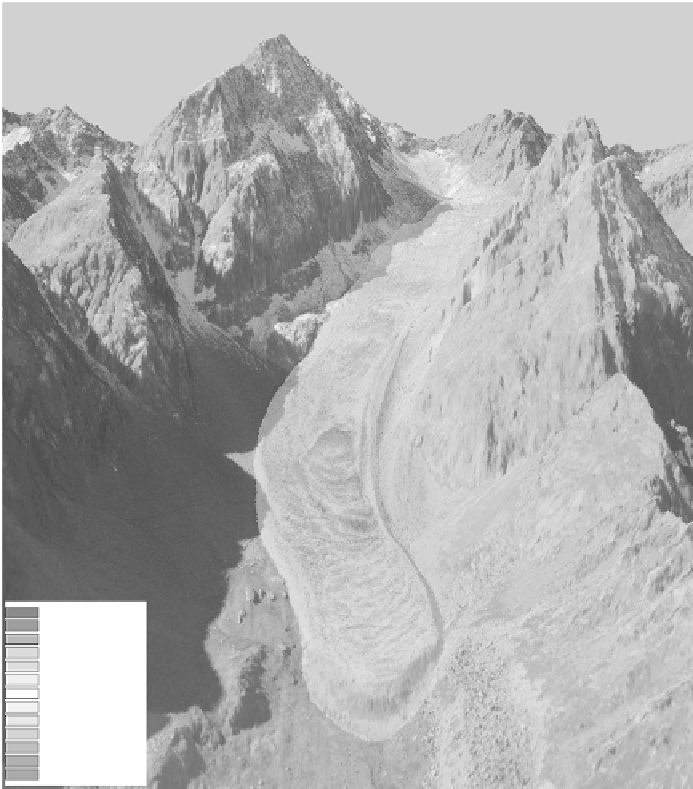
Figure 3.3.
Surface elevation change of Reichenkar rock glacier (Austrian Alps), derived from
multi-temporal airborne laser scanner data. Blue indicates positive elevation changes, white a
'stable' surface and yellow to red colours indicate negative elevation changes. Note: The area
with blue colours are indicating horizontal motion, elaboration by the authors.
Color image of this figure appears in the color plate section at the end of the topic.
• overall, reliable old species inventories are rare and missing for most
of the high mountain areas; this makes it diffi cult to use high mountain
areas as otherwise ideal sites for comparative studies of cold habitats
across the world;
• life at the low-temperature limits, especially vascular plants, are
excellent indicators for an ecological assessment of the impact of

Search WWH ::

Custom Search