Biomedical Engineering Reference
In-Depth Information
Electron Ground State
|ψ
e
|
2
D
≈
1nm
D
≈
2nm
D
≈
4.1nm
D
≈
6.2nm
D
≈
8.3nm
Hole Ground State
|ψ
1
h
|
2
D
≈
1nm
D
≈
2nm
D
≈
4.1nm
D
≈
6.2nm
D
≈
8.3nm
h
1
,
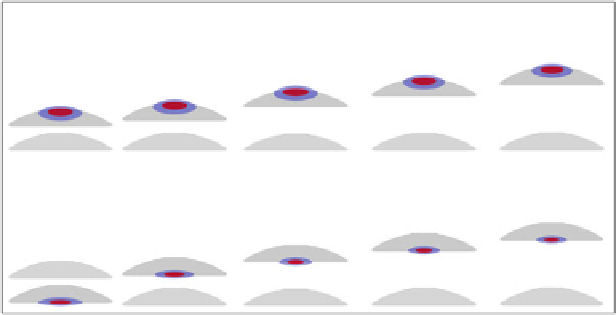
respectively, for different barrier thicknesses
D
. The QD geometry is shown in
light gray
and the
blue
(
red
) probability density isosurface correspond to 10% (50%) of the maximum value. Upper
QD: In
0
.
25
Ga
0
.
75
N; Lower QD: In
0
.
2
Ga
0
.
8
N. [From [
92
]]
e
1
and
Fig. 6.11
Probability densities of the electron and hole ground state wave functions
ψ
ψ
h
e
dot (In
0
.
25
Ga
0
.
75
N QD). For larger values of
D
both
1
are localized on the
upper dot. The reason for this switching originates again from the behavior of the
built-in potential
ψ
1
and
ψ
φ
tot
returns
to zero quickly along the
c
-axis and changes sign a few nanometers away from
the dot along the
c
-axis, affecting therefore
φ
tot
above and below an isolated QD. Outside the QD,
φ
tot
in a QDM. Line-scans through the
center of the QDM along the
c
-axis for different
D
are shown in Fig.
6.12
.Again,
the behavior of
φ
tot
can be understood by superimposing built-in potentials for two
isolated QDs with their bases centered at
z
=
0and
z
=
h
+
D
, respectively, where
h
is the height of the lower QD.
The results for the isolated QDs are given by the dashed-dotted line and the
dashed line, respectively. In the case of
D
φ
tot
in the
upper (lower) QD is reduced at the bottom (top), and almost unchanged at the top
(bottom) compared to an isolated QD. Therefore, the electron wave functions could
be expected to be localized at the top of the upper QD while the hole states are
expected to be localized at the bottom of the lower QD. This is exactly the result we
obtain from our TB analysis [cf. Fig.
6.11
]. For
D
≈
1 nm (a), the magnitude of
≥
2 nm, the change in sign in
φ
tot
outside a single QD becomes important. For
D
φ
tot
is slightly reduced in
magnitude at the top (bottom) of the upper (lower) QD while increased in magnitude
at the bottom (top) of the upper (lower) QD [cf. Fig.
6.12
c and d]. In the case of
D
≥
4
.
1nm,
φ
tot
is decreased in magnitude at all four interfaces [cf. Fig.
6.12
b]. From
Fig.
6.12
b-d one could expect that
≈
2nm,
e
ψ
1
is localized at the top of the upper QD while
h
ψ
1
is expected to be localized at the bottom of the upper QD, in full accordance
with our TB results [cf. Fig.
6.11
].
The
behavior
of
φ
tot
affects
also
the
ground
state
transition
energies
E
QDM
E
1
,where
E
1
and
E
1
are ground state energies for electrons and
holes, respectively. The blue dashed line in Fig.
6.13
shows the calculated value
E
1
−
=
g