Biomedical Engineering Reference
In-Depth Information
a
b
D
≈
1nm
D
≈
2nm
0.6
0.6
0.4
0.4
0.2
0.2
0
0
−0.2
−0.2
−0.4
−0.4
202468 0 2
z (nm)
−2
0
2
4
6
8
10
12
z (nm)
c
d
D
≈
4.1nm
D
≈
6.2nm
0.6
0.6
0.4
0.4
0.2
0.2
0
0
−0.2
−0.2
−0.4
−0.4
−2
0
2
4
6
8
10
12
−2
0
2
4
6
8
10
12
14
z (nm)
z (nm)
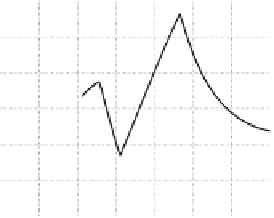
Fig. 6.12
tot
(
solid black line
)ina
c
-plane QDM of two non-identical QDs
(lower QD: In
0
.
2
Ga
0
.
8
N; upper QD: In
0
.
25
Ga
0
.
75
N) for a line-scan through the center of the QDs
along the
c
-axis and for different barrier thickness
D
between the QDs. The (
blue
)
dashed-dotted
line
and the (
red
)
dashed line
indicate the results for isolated QDs. [From [
92
]]
Built-in potential
φ
of
E
QD
g
as a function of
D
(dashed line). This is compared to the transition
energy
E
QD
g
of a single In
0
.
25
Ga
0
.
75
N QD (dashed-dotted line). Figure
6.13
also displays the normalized squared dipole matrix element
d
11
|
2
,
d
efinedby
|
√
2
d
11
d
QDM
11
d
QD
11
2
2
2
, with
d
11
=
e
1
h
1
|
|
=
|
|
/|
|
·
ψ
|
|
ψ
=
/
(
,
,
)
is
the light polarization vector and
e
0
r
the dipole operator, with
e
0
being the electron
charge. The dipole matrix elements of a single In
0
.
25
Ga
0
.
75
NQDandtheQDM
are denoted by
d
QD
11
e
e
0
r
,where
e
1
1
1
0
and
d
QDM
11
, respectively. The calculation of the dipole matrix
elements is performed following the method in [
55
,
93
]
It can be seen from Fig.
6.13
that the energies
E
QDM
g
are blue shifted with respect
to
E
Q
g
. This behavior is due in part to the reduction of the biaxial compressive strain
in the upper dot compared to an isolated QD. Additionally, the effective reduction of
φ
tot
in the QDM compared to a single dot also contributes to the blue-shift in
E
QDM
.
g
This effective reduction of
φ
tot
also increases the spatial overlap of electron and hole
d
11
|
2
1
wave functions so that
|
>
1. Neglecting the results for
D
≈
1nm,where
ψ