Biomedical Engineering Reference
In-Depth Information
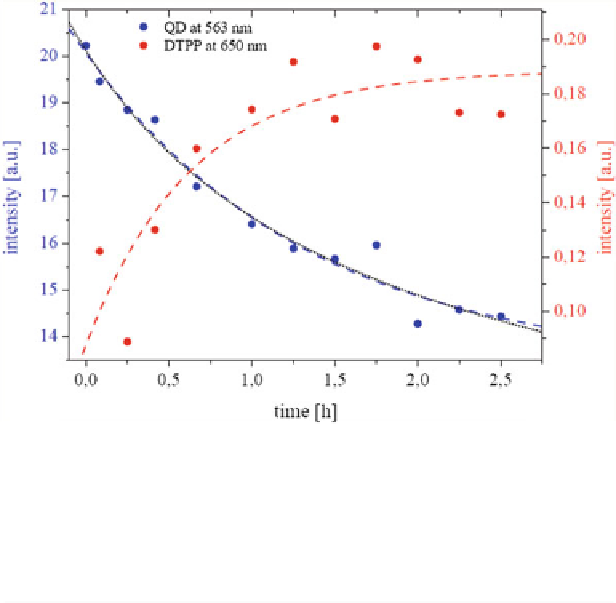
Fig. 4.28
7. The
first DTPP spectra have been taken about 1 min after titration. Lines are bi-exponential fits for
CdSe/ZnS and mono-exponential for DTTP
Time-dependent luminescence intensities of CdSe/ZnS QDs and DTPP at
x
=
Tabl e 4. 3
Comparison of time-dependent luminescence intensities of CdSe/ZnS
(QD) and DTPP for variable concentration ratios in TEHOS (A) and in toluene:
TEHOS mixture at different volume ratio R (B)
x
QD/DTPP
I
end
(a.u.)
A
1
(a.u.)
τ
1
(min)
A
2
(a.u.)
τ
2
(min)
(A) Pure TEHOS,
x
=
[
C
Dye
]/[
C
QD
]
1
D
7
±
1
5.9
±
0. 9
103
±
31
DTPP
0.13
±
0.02
0.07
±
0.01
137
±
36
3
QD
11.8
±
0.9
1.9
±
0.4
35
±
10
6.4
±
0.5
157
±
43
DTPP
0.19
±
0.02
0.10
±
0.02
38
±
12
5
QD
11.2
±
0.5
10.1
±
0.5
63
±
9
DTPP
0.46
±
0.09
0.31
±
0.08
150
±
90
7
QD
11.5
±
0, 2
30
±
1.4
62
±
21
4.4
±
1.7
24
±
6
DTPP
0.28
±
0.01
0.09
±
0.01
58
±
18
10
QD
14.1
±
0.6
7.2
±
4.1
47
±
28
4.7
±
1.9
14
±
9
DTPP
0.24
±
0.05
0.04
±
0.01
54
±
33
(B)
x
=
[
C
Dye
]/[
C
QD
]
=
5, volume ratio
R
=
toluene:TEHOS
1
D
±
1
5.9
±
0. 9
103
±
31
DTPP
0.13
±
0.02
0.07
±
0.01
137
±
36
3
QD
11.8
±
0.9
1.9
±
0.4
35
±
10
6.4
±
0.5
157
±
43
DTPP
0.19
±
0.02
0.10
±
0.02
38
±
12
respectively, during the observation time. The comparison shows that one of the
PL quenching times is very close to the DTPP increase. Therefore we assign this
component of the PL quenching to FRET-related quenching, whereas the second
component is related to non-FRET quenching.