Biomedical Engineering Reference
In-Depth Information
Fig. 4.26
Normalized PL
intensities of CdSe/ZnS QDs
upon titration of
(m-Pyr)
4
-H
2
P as a function of
the molar ratio
x
[H
2
P]/[QD] in
n
-octane
(
crossed markers
) and toluene
(
solid markers
). Adapted
from [
64
]
=
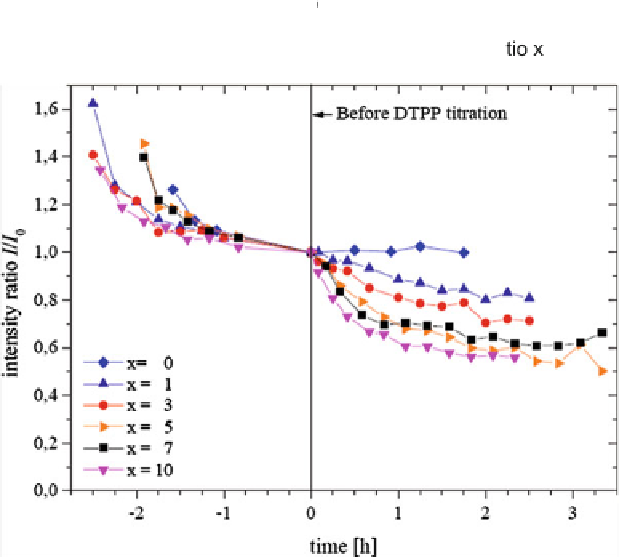
Fig. 4.27
Titration of CdSe/ZnS QDs in TEHOS for various relative DTPP molar ratios
x
at
t
=
0. The first spectra are taken 1 min after titration. Before
t
=
0 all samples come nearly to
an equilibrium with
x
=
0 in each case. Spectra have been normalized at
t
=
0
evident that the quenching immediately after the respective titration step is very
small but increases within hours as a function of
x
. The quenching time becomes
shorter with increasing
x
.
A more detailed view on the time dependence of the PL quenching is depicted
for
x
7inFig.
4.28
, which shows a comparable increase of DTPP fluorescence on
the same time scale.
Tab le
4.3
summarizes for a few ratios
x
the fit results for bi- or mono-exponential
functions
=
for
the
QD
PL
quenching and
DTPP
fluorescence
enhancement,