Biomedical Engineering Reference
In-Depth Information
a
b
Control
S
n
g
e
k
n
o
k
t
400
400
CD8
Clone 1:
CD4
CD8
CD4
CD8
Clone 1:
CD8+
Clone 2:
300
300
Clone 2:
CD8+
Clone 3:
CD4
CD8
CD4
200
200
Clone 4:
Clone 1:
CD4+
Clone 2:
CD4+
100
100
0
0
0
5
10
15
0
5
10
15
Time (days)
Time (days)
c
d
Double knockout
Triple knockout
400
400
300
300
Clone 3:
CD8+
Clone 4:
CD8+
200
200
Clone:
CD4+
Clone:
CD4+
100
100
0
0
0
5
10
15
0
5
10
15
Time (days)
Time (days)
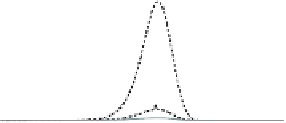
Fig. 9
Extended immunodominance model: time evolution of effector
cell populations for
Scenario 2. Four T cell clones are present with the same reactivity
p
i
=
1
/
2 and initial naıve
CD8+ concentrations
K
1
(
04,
K
2
(
01,
K
3
(
10
−
3
,and
K
4
(
10
−
4
0
)=
0
.
0
)=
0
.
0
)=
2
.
5
×
0
)=
6
.
25
×
L. Initial naıve CD4+ concentrations are given by
H
i
(
5
K
i
(
k/
. Parameters that are not
listed in Table
2
are taken from Table
1
.(
a
) Control experiment: clones 1-4 all respond. (
b
)SKO:
clone 1 is removed. Only clones 2-4 respond. (
c
) DKO: clones 1 and 2 are removed. Only clones
3 and 4 respond. (
d
) TKO: clones 1-3 are removed. Only clone 4 responds
μ
0
)=
1
.
0
)
self-organizing phenomenon among simultaneous T cell responses that serves to
improve the overall quality (rather than just the quantity) of the T cell repertoire.
To compare with the basic model Eqs. (
1
)and(
2
), we simulate
Scenario 2
from
Sect.
4
with the extended model Eqs. (
7
)-(
14
). Following Senario 2 of the basic
model, we consider four T cell clones with the same reactivities that only differ
in terms of their initial concentrations. All reactivities are assumed to be identical:
p
i
=
1
/
2,
i
=
1
,...,
4, and the initial concentrations of naıve CD8+ cells are taken
as:
K
1
(
L,
K
2
(
L,
K
3
(
10
−
3
k/
L, and
K
4
(
0
)=
0
.
04 k/
μ
0
)=
0
.
01 k/
μ
0
)=
2
.
5
×
μ
0
)=
10
−
4
k/
6
.
25
×
μ
L. For each clone, the initial concentrations of naıve CD4+ cells are
taken to be
H
i
(
5
K
i
(
0
)=
1
.
0
)
, which is a typical observed proportion of CD4+ and
CD8+ T cells [
5
].
The results of the simulation are shown in Fig.
9
.InFig.
9
a we see that the four
T cell clones fall into a hierarchy based on their initial concentrations. When the


Search WWH ::

Custom Search