Biomedical Engineering Reference
In-Depth Information
a
b
Primary response
Secondary response
200
500
Clone 1
Clone 2
400
150
300
100
200
50
100
0
0
0
5
10
15
0
5
10
15
Time (days)
Time (days)
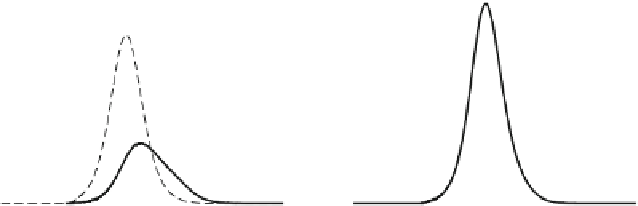
Fig. 8
Basic immunodominance model: time evolution of effector cell populations for Scenario
3. (
a
) Primary response. The less reactive clone is more common. Initial concentrations for the two
clones are
K
1
(
004 and
K
2
(
L. (
b
) Secondary response. The two clones have
switched places, and now the more reactive clone is more common. Initial concentrations for the
two clones are
K
1
(
0
)=
0
.
0
)=
0
.
04 k/
μ
04 and
K
2
(
0
)=
0
.
0
)=
0
.
004 k/
μ
L. All other parameters are taken from Table
1
clone 1, ends up producing a more long-lived T cell response than clone 2, and
so it follows that this clone might also end up producing a greater number of
memory T cells and hence a stronger secondary response. For now, we leave the
explicit modeling of memory T cell formation for a future work. Nonetheless,
we see from Fig.
8
a that iTreg-mediated contraction could give rise to a natural
process of “collective affinity maturation” that enables the memory repertoire to
select for highly reactive clones even when these clones do not produce the most
dominant primary responses.
Without explicitly modeling memory T cell formation, let us suppose that
between primary and secondary responses, the composition of the T cell repertoire
shifts in favor of the more reactive T cell clone. In particular, suppose that for
the hypothetical secondary response, the initial concentrations are reversed. Then,
Fig.
8
b shows that clone 1 clearly dominates the secondary response. Furthermore,
both primary and secondary responses start with the same total initial concentration
of T cells, but a much stronger response from clone 1 causes the combined
secondary response to peak at over twice the height of the combined primary
response.
For simplicity, we generated a hypothetical secondary response by switching the
initial concentrations of the two T cell populations, but there is no reason to assume
that initial concentrations must switch or that the total initial population must stay
the same. In fact, the memory pool generated after a primary response is probably
larger than the original naıve T cell pool. Yet even with this simplified view of
collective affinity maturation, we see that simple shifts in the relative distribution
of T cell clones may result in large differences in subsequent responses. Hence,
a mechanism of immunodominance mediated by iTregs may serve as a global,


Search WWH ::

Custom Search