Biomedical Engineering Reference
In-Depth Information
a
b
2.5
1.6
K
0
(0) = 0.4
1.4
K
0
(0) = 4
2
1.2
K
0
(0) = 0.4
K
0
(0) = 0.04
1.5
1
0.8
K
0
(0) = 0.04
K
0
(0) = 0.004
1
0.6
K
0
(0) = 0.004
0.5
0.4
0.2
0
K
0
(0) = 0.0004
0
-0.5
-0.2
-500
0
500
1000
1500
2000
2500
-200
0
200
400
600
800
1000
1200
K
total
(
t
) (k/
μ
L)
K
total
(
t
) (k/μL)
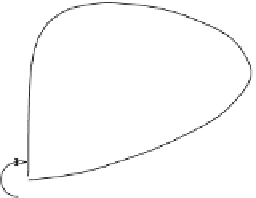
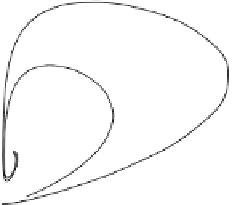
Fig. 5
Phase portraits of iTreg versus effector dynamics over 20 days. (
a
) Five different precursor
frequencies,
K
0
L. The curve for
K
0
(
0
)=
0
.
0004, 0
.
004, 0
.
04, 0
.
4, and 4k/
μ
(
0
)=
0
.
04 corresponds
to Fig.
4
.(
b
) T cell dynamics under persistent antigen stimulation, i.e.,
b
=
1
,
000 days for three
different precursor frequencies,
K
0
(
0
)=
0
.
004, 0
.
04, and 0
.
4k/
μ
L
models. All phase portraits exhibit similar shapes and return to the resting state in a
timely fashion. The phase portraits represent the dynamics over 20 days as in Fig.
4
.
Figure
5
b shows similar phase portraits as in Fig.
5
a, except that the duration,
b
,
of antigen presentation is set to 1,000 days so that antigen is chronically presented.
The figure shows that the effector and iTreg populations spiral into a stable fixed
point. The elongated shapes form as a result of the rapid increase in the level of
antigen presentation by mature APCs over the first few days after infection before
decaying to a steady level several days later. The brief burst of mature APC levels in
the lymph node allows the effector concentration to expand rapidly for a brief time
before being attracted to the stable fixed point.
4.2
Immunodominance: Numerical Simulations
We start by showing results that were obtained from simulating the basic im-
munodominance model from Sect.
3.2
. We numerically simulate solutions to Eqs.
(
15
)-(
19
). The numerical solution is obtained using the DDE solver “dde23”
in MATLAB R2008a. We consider several scenarios of multiple T cell clones
responding to the same target at once. Each T cell clone is characterized by its
reactivity to target antigen,
p
i
, and its initial concentration,
K
i
(
)
0
.
Scenario 1.
(Five T cell clones, different reactivities). We consider five T cell
clones that differ only in terms of their reactivities to the target antigen. For
i
2
−
i
. The initial concentrations are given
=
,...,
=
1
5 we set reactivity #
i
as
p
i
by
K
i
(
)=
.
∀
0
0
01 k/
μ
L,
i
. We also consider cases of single knockout (SKO),


Search WWH ::

Custom Search