Biomedical Engineering Reference
In-Depth Information
a
b
10
500
Immature APCs
9
450
Total effector cells
8
400
7
350
6
300
5
250
4
200
3
150
Mature APCs
2
100
100
x
iTregs
1
50
1,000
x
Naive cells
0
0
0
5
10
15
20
0
5
10
15
20
Time (day)
Time (day)
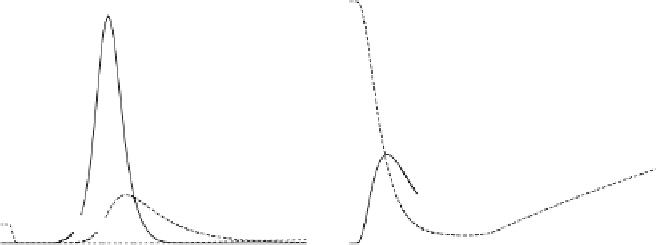
Fig. 4
Time evolution of immune cell populations. (
a
) The dynamics of naıve, effector, and
regulatory T cells over 20 days. (
b
) The dynamics of immature and mature APCs
from Sect.
3.1
. We provide one example of simulations of the extended model from
Sect.
3.2
. Additional simulations of the extended model can be found in [
16
].
4.1
Adaptive Regulation: Numerical Simulations
We start by numerically solving Eqs. (
1
)-(
5
). The model parameters are set
according to Table
1
. The simulations are done using the DDE solver “dde23” in
MATLAB R2008a. The time evolution of the different cell populations is shown in
Fig.
4
.
It is evident from Fig.
4
that nearly all available antigen-specific naıve T cells
are recruited within a day of antigen presentation, a result corroborated by the
experimental data of [
20
]. In addition, the effector cell and mature APC populations
peak at day 7.0 and day 2.5. In our model, the variable
t
corresponds to the time after
antigen presentation begins in the lymph node. This event occurs approximately
one day after infection [
3
]. Hence, our simulated measurements translate to T cell
and APC peaks at day 8.0 and day 3.5 after infection. These results coincide well
with the experimental measurements that the T cell and APC populations peak at
around day 8 and day 3.2 after infection (see [
3
,
9
]).
Figure
5
a displays phase portraits of the iTreg versus the effector population
for initial naıve cell concentrations of 0.0004, 0.004, 0.04, 0.4, and 4k/
L. The
five curves correspond to population doublings of 18.4, 15.9, 13.6, 11.3, and
9.1, respectively, showing that every tenfold increase or decrease in precursor
concentrations corresponds to approximately 2.2 fewer or 2.2 additional divisions
that adjust the difference. Thus, larger initial conditions lead to larger T cell
responses, but not at the level of sensitivity exhibited by the two program-based
μ


Search WWH ::

Custom Search