Biomedical Engineering Reference
In-Depth Information
of facial features of thermal and visible images is compared with the matching of
thermal and visible images of heads.
For each subject, an equally random division of the image database is made so that
9 images per individual are used for testing and the remaining 9 for training purposes
(50% hold-out validation method). As previously commented, 369 test images and 369
training images randomly chosen are available for the experiments in each modality.
This division is carried out 41 times that is subject by subject in 41 iterations.
The process of face/head verification for a subject is the following. Firstly, the pre-
viously stated division of the database is made. Secondly, each of the 9 images of the
test subject is compared with the 369 training images and results are obtained. Once
these 9 images are processed, the database is joined together again and the process
restarts with the next subject until the 41 subjects of the database are processed.
The parameters that take part in the experiments are the False Rejection Rate
(FRR), False Acceptance Rate (FAR) and Equal Error Rate (EER), commonly used in
biometric studies. Mean times are also considered in this study. These parameters are
collected in form of vectors depending on a variable, the histogram threshold.
(a)
(b)
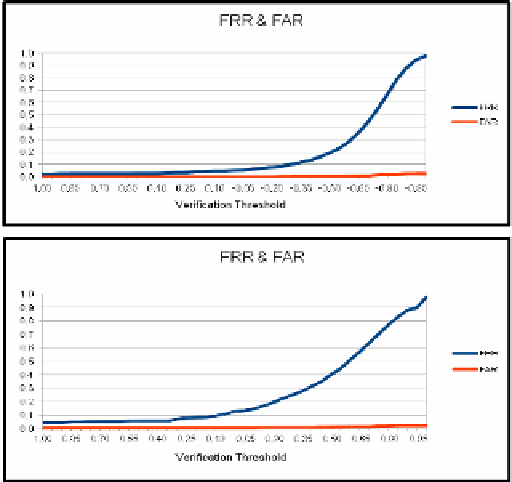
Fig. 7.
FRR (blue line) and FAR (red line) in terms of the histogram threshold in (a), visible
head verification, and in (b), thermal head verification.
Since the verification process finishes, a histogram with the contributions of each
image in the database is obtained. The database image that best fits the test image
shows the biggest value in the histogram. In a second stage, histogram values are
normalized with regard to the biggest value, from 1 to -1. A threshold is used during
the experiments for considering only the contributions of images that are above this
limit; those below are discarded in that moment. The histogram threshold descends
Search WWH ::

Custom Search