Biomedical Engineering Reference
In-Depth Information
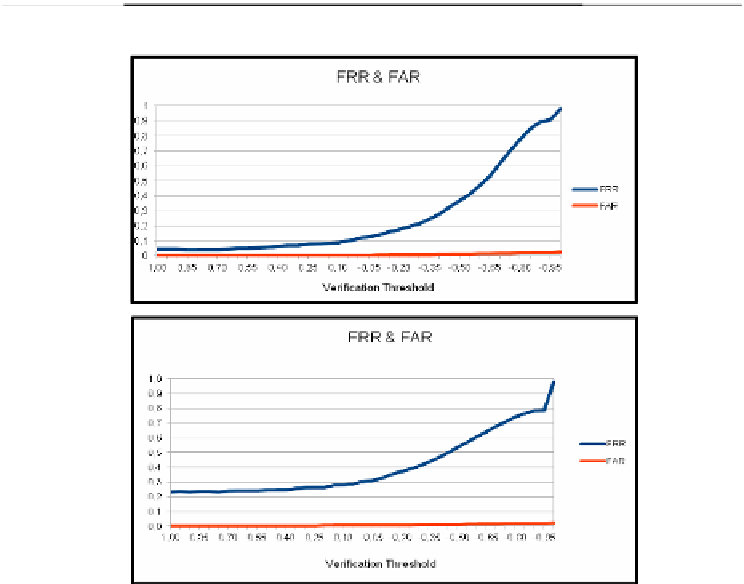
from value 1 to -1 in order to consider different samples each time. In figure 7 and 8
FRR and FAR are shown in relation to the histogram threshold. X-axis represents the
threshold variation and Y-axis shows FRR and FAR values.
In practical terms, the threshold fall represents how the system becomes less de-
manding, taking more samples in account, increasing the FRR and FAR, since the
additional samples do not belong to the test subject.
In table 1, it is shown average computational times. Although the verification time
remains the same, the database updating (model building time) with head images is
substantially higher as these images possess more information than facial images and
therefore, consume more time and need more computational effort.
Table 1.
Average Computational Times of head and face images verification during the
experiment for thermal and visible ranges
MEAN TIMES HEAD AND FACE IMAGES
Visible Head Time
(sec.)
Visible Face Time
(sec.)
Thermal Head Time
(sec.)
Thermal Face Time
(sec.)
Concept
Model Building
283.47
135.08
121.56
102.55
Test Verification
0.49
0.28
0.26
0.26
(a)
(b)
Fig. 8.
FRR (blue line) and FAR (red line) in terms of the histogram threshold in (a), visible
facial verification and in (b) thermal facial verification


Search WWH ::

Custom Search