Biomedical Engineering Reference
In-Depth Information
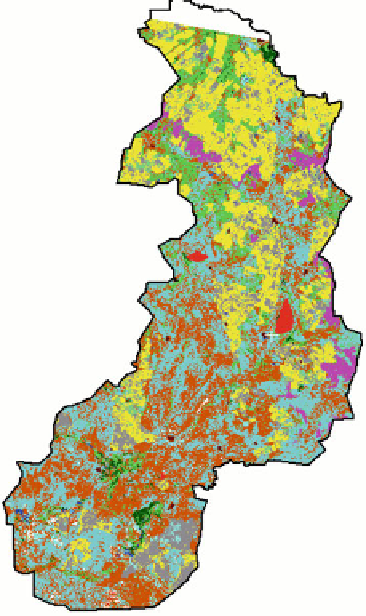
Crop
Long fallow
Current fallow
Steppe land
Wasteland
Barren / Rocky
Gullied
Sandy area
Water
Salt affected
Aquatic veg.
Built up land
Fig. 3
Land cover map of May
Vegetation Density and Land Surface Temperature
The mean LST values under different vegetation density classes (Figs.
6
and
7
) for
nonvegetated and vegetated surfaces are given in Table
4
.
Within vegetated surface (i.e. from VD8 to VD13) considerable difference in
surface temperature exists (*4K) in May due to differential crop growth and
water balance. In general, surface temperature decreased with increased vegetation
density, primarily due to low canopy air temperature difference as a result of high
evaporative flux under unlimiting soil moisture. Similar trend is also observed in
August except in higher vegetation density (VD12 and VD13) where the LST
increases (Fig.
8
), which indicates senescent vegetation with low evapotranspi-
ration under limiting soil moisture. However, the dynamic range is *4K which is
similar in both the dates of overpass.
The spatial variability of LST is higher over nonvegetated surface in both May
(5.5K) and August (9.8K). The variation in August is more due to high air
temperature induced large spatial dynamics of thermal inertia over water and bare


Search WWH ::

Custom Search