Biomedical Engineering Reference
In-Depth Information
all models. If we posit that the urethane elastomer membrane of
rectangular cross section of Fig. 4.10 is under a tensile force
F
when
placed inside the polariscope in Fig. 4.6 instead of the vasculature
model, the longitudinal stress
T
1
is given by
T
1
F
LD
(4.26)
where
L
and
D
are the width and thickness of the membrane's
cross section. Because in this case
T
2
equals zero, the stress in the
membrane may be calculated using equation (4.4) or (4.26).
Quarter-wave plates
0L
ex
L
ex
L
ex
Force
Sensor
L
ex
L
ex
Urethane Membrane
F
L
White
Light
Source
Urethane
Membrane
Region of Interest
a)
5
0mm
b)
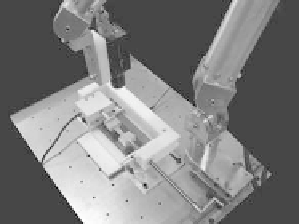
Figure 4.10
(a) Variable tension device for photoelastic coeficient
calculation. (b) Membrane used for deducing the photoelastic
coeficient of urethane elastomer.
Therefore, we are able to calculate the photoelastic coeficient of
urethane elastomer
C
using
Re
L
C
(4.27)
F
We built the device shown in Fig. 4.10a, composed of a C-clamp
and a force sensor for gradually applying and measuring tension
to the membrane. Some of the elements of the polariscope are
shown in this igure. A total of 19 samples were captured obtaining
simultaneous measurements of Re,
F
and
L
. Figure 4.10b shows the
membrane inside the polariscope when
F
= 2.1 N, Re is measured
after calibrating the camera from the average of green light intensity
at the region of interest and equation (4.22). Tension was applied to
the membrane in a range of 0.3-3.7
N, while the photoelastic images
were captured for visualizing the irst fringe.
L
is obtained from the
image captured when force is applied to the membrane. For this
experiment,
M
G
was found to be 521
nm. Figure 4.11 shows the plot of


Search WWH ::

Custom Search