Biomedical Engineering Reference
In-Depth Information
any frequency content above the highest frequency of the signal, and sample at a rate of at
least 2.5 times the highest frequency. The transfer function is then estimated.
13.10.2 Identification of a Linear First-Order System
The technique for solving for the parameters of a first-order system is presented here.
Assume that the system of interest is a first-order system that is excited with a step input.
The response to the input is
t
t
y
ð
t
Þ¼
y
ss
þ
Ke
u
ð
t
Þ
ð
13
:
70
Þ
where
the response is
63 percent of the way from the initial to the steady-state value. Similarly, at
K
¼
y
ss
y
ð
ð
0
Þ
Þ
and is shown in Figure 13.64. Note that at
t
¼
t
,
t
¼
4
t, the
response is 98 percent of the way from the initial to the steady-state value.
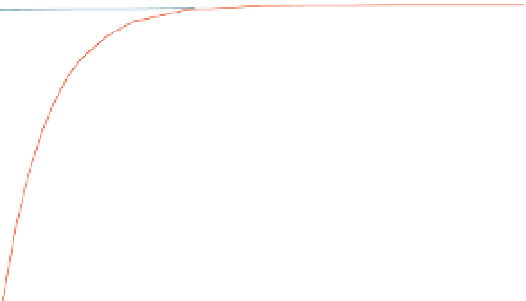
Suppose step input data are collected from an unknown first-order system shown in
Figure 13.64. To fully describe the system, the parameters of Eq. (13.70) need to be esti-
mated. One way to estimate the system time constant is from the initial slope of the
response and a smoothed steady-state value (via averaging). That is, the time constant t
is found from
t
t
t
t
1
t
¼
y
ss
y
ðÞ
0
y
ð
t
Þ¼
ð
y
ss
y
ð
0
Þ
Þ
e
!
t
e
y
ð
t
Þ
¼
y
ss
y
ðÞ
0
At
t
¼
0, t
, where
y
ð
0
Þ
is the initial slope of the response. The equation for
y
ð
0
Þ
estimating t is nothing more than the equation of a straight line. This technique is illustrated
in Figure 13.65.
y
ss
y
( )
y
(0)
0
Time
FIGURE 13.64
First-order system response to a step input.