Biomedical Engineering Reference
In-Depth Information
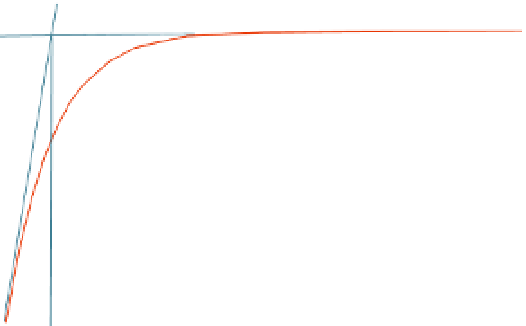
Tangent to the response at t
= 0
y
ss
y
(
)
0.63 (
y
ss
-
y
(0))
y
(0)
0
Time
FIGURE 13.65
Estimating the time constant from the initial slope of the response.
EXAMPLE PROBLEM 13.10
The data in Table 13.4 were collected for the step response for an unknown first-order system.
Find the parameters that describe the model.
TABLE 13.4
Data for Example Problem 13.10
t
00.0
00.05
00.1
00.15
00.2
0.25
00.3
00.4
00.5
00.7
1.0
1.5
2.0
y(t)
00.0
00.56
00.98
1.30
1.54
1.73
1.86
2.04
2.15
2.24
2.27
2.28
2.28
Solution
The model under consideration is described by Eq. (13.70),
t
y
ðÞ¼
y
ss
þ
Ke
u
ðÞ
, with unknown
parameters
y
ss
,
K
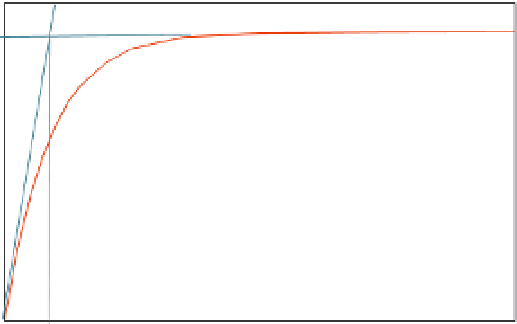
, and t. The data are plotted in Figure 13.66, along with the tangent. Clearly
y
ss
¼
2.28 and
K
¼
-2.88.
2.5
y
ss
2
1.5
1
0.5
0
0
0.5
1
1.5
2
Time
FIGURE 13.66
Illustration for Example Problem 13.10.
Continued