Biomedical Engineering Reference
In-Depth Information
if the segments are consecutive and disjoint. The power estimate based on the DFT of an
individual segment “
”is
i
2
N
1
1
N
2 p
mk
N
P
i
ð
m
Þ¼
0
x
i
ð
k
Þ
e
j
for 0
m
N
1
ð
11
:
53
Þ
k
¼
where
m
is associated with the power at a frequency of
O ¼
2
p
m
/
N
radians. The averaged
signal spectrum is calculated by taking the mean at each frequency
X
L
1
L
P
ð
m
Þ¼
1
P
i
ð
m
Þ
ð
11
:
54
Þ
i
¼
determines the resolution in the frequency
domain. For example, if data are sampled at 500 samples/s and the resolution is desired at
the 1 Hz level, at least 1 second or 500 samples (
The selection of
is very important, since
N
N
N
¼
500) should be included in each of the
L
sections. If resolution at the 10 Hz level is sufficient, only 0.1 seconds or 50 data points
need to be included in each section. Note that the reduction in the frequency resolution
leads to improvement in the certainty of the measurement because one can now average
more signal segments. The averaging procedure decreases the variance by a factor of 1/
.
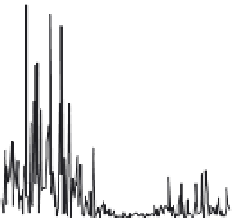
This averaging process is demonstrated for the EEG data in Figure 11.27. Modifications to
L
x 10
5
1024 DFT OF EEG DATA
3
2
1
0
0
0.2
0.4
0.6
0.8
1
x 10
5
AVERAGE OF 16 64-POINT DFTS
3
2
1
0
0.4
0
0.2
0.6
0.8
1
NORMALIZED
Ω
FIGURE 11.27
DFT averaging of an EEG. The top trace shows the raw DFT. The bottom trace shows the
periodogram-averaged DFT obtained with 16 64-point segments of the data.