Biomedical Engineering Reference
In-Depth Information
Trial 1
+
Trial 2
+
Trial 3
+
Trial 4
+
II
10 msec
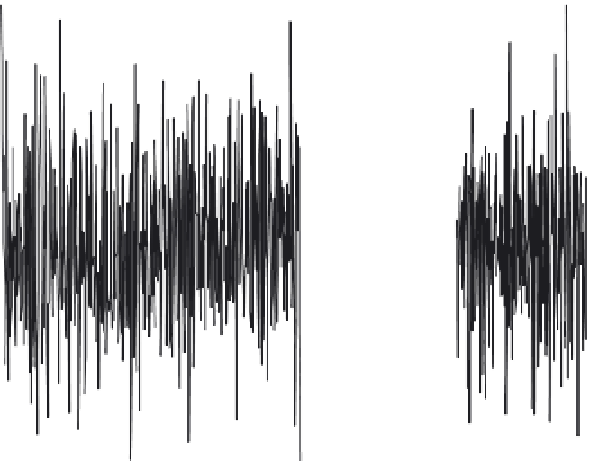
FIGURE 11.25
Single trials from an auditory evoked response to a brief sound pulse (at time zero)
were measured on the temporal lobe. The auditory response from individual trials is obscured by random
noise (shown first 4 out of 1,000). Averaged response of 1,000 trials reveals the auditory response component
(bottom trace).
EEG (mv)
500
400
300
200
100
0
−
100
−
200
−
300
−
400
−
500
0
200
400
600
800
1000
k (sample number)
FIGURE 11.26
An EEG signal containing 1,000 samples sampled at 16 kHz from the occipital.