Biomedical Engineering Reference
In-Depth Information
1
0.9
0.8
0.7
0.6
0.5
gray matter
white matter
0.4
0.3
0.2
0.1
0
0
500
1000
1500
2000
2500
Time (ms)
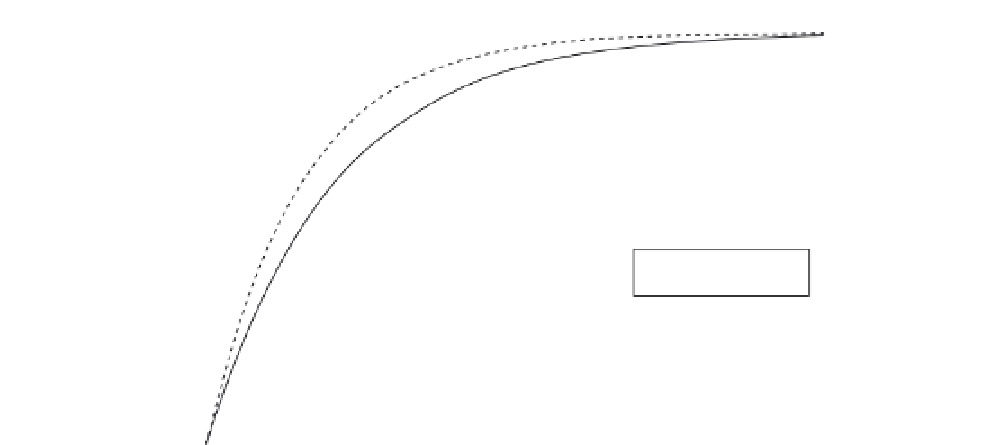
FIGURE 16.51
Longitudinal magnetization versus time for gray matter and white matter.
differences in the
T
2
weighted images are used. Because these
changes are very small, images before and after task initiation are subtracted from each
other and the resultant difference image is overlaid on a standard image. Special care must
be taken when obtaining these images because the effect is small and can be corrupted by
several sources of noise. Typically, hundreds of images are taken for each slice plane posi-
tion and statistical analysis is used to produce the final image. Sources of noise errors are
thermal noise, head movement, and respiratory and cardiac cycles. An example of an fMRI
image is shown in Figure 16.52 [5].
Functional MRI has been used extensively to map regions of the brain connected with
stimuli, activities, and higher-level cognition. Another example of this type of neuroimaging—
biological motion perception—was studied in humans [7]. Subjects were placed in an MRI
scanner so they could view moving images while they were being imaged in real-time.
Experiments involved biological motion (BM) perception, face recognition, and nonrigid
motion (NRM) perception. In Figure 16.53, results from experiments involving these vari-
ables are displayed as color-coded regions in three-dimensional reconstructions of a brain.
Note the degree of spatial resolution, localization, and discrimination achieved for distinct
activities.
T
*
2
decay constant, so
16.4 MAGNETOENCEPHALOGRAPHY
Magnetoencephalography (MEG) is a form of neuroimaging that maps the tangential
components of magnetic fields associated with scalp potentials produced by the brain [3].
These potentials are the same ones that can be recorded as electroencephalograms (EEGs),
but the dynamic magnetic components of these potentials contain different information