Biomedical Engineering Reference
In-Depth Information
(a)
Pulse duration:
0.5 s
1.0 s
850
900
950
1000
1050
(b)
Nernstian slope
28 mV/decade
175
150
125
100
4.2
4
3.8
3.6
log
a
Ca
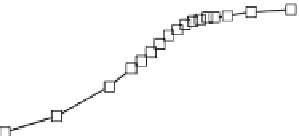
FIGURE 4.12
Pulsed chronopotentiometric (a) and differential (b) response of a calcium pulstrode in
artifi cial ten times diluted blood serum [59]. Cathodic current pulses of 10
A cm
1
) and 1 sec
µ
A (125
µ
duration are followed by a stripping potential of
30 mV applied for 180 sec. Potentials were sampled at
0.5 and 1.0 sec of each pulse and are the averages over preceding 100 msec. The Nernstian response slope of
29 mV decade
1
is shown for comparison.
potentials are observed in this super-Nernstian region. In contrast, pulstrodes allow one
to obtain robust and fully reproducible potential readings in the super-Nernstian region,
as full control of the system is performed by instrumental means.
In the experiment illustrated in Fig. 4.12b differential calcium responses were
obtained from a single sensor at different durations of the current pulse in artifi cial
diluted (tenfold) serum [59]. Observed super-Nernstian response was set within the
physiological range of calcium activity by choosing the appropriate current. Note that
the observed differential response slope in Fig. 4.12b achieved 50 mV per 0.2 logarith-
mic units of calcium activity, which corresponds to a remarkable eightfold increase
in sensitivity in a very narrow activity window compared to the traditional 29 mV
decade
1
, which is the slope of ordinary potentiometric Ca-selective electrodes. The
differential response region may be easily tuned by variation of the current pulse
parameters such as duration and magnitude of the applied current [55]. Due to the high
sensitivity of differential response, pulstrodes are intended for applications requiring
detection of a small change in activity of a target ion, which is common in the moni-
toring of blood electrolytes.


Search WWH ::

Custom Search