Biomedical Engineering Reference
In-Depth Information
NO
2
1200
Hb
NR
NO
3
NO
1000
NAD
NADH
800
600
400
200
NR
0
0
200
400
600
800
1000
1200
1400
Time (s)
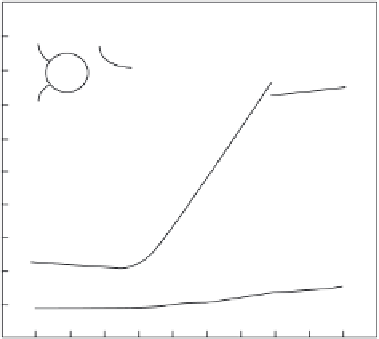
FIGURE 1.12
NO production from the addition of nitrate reductase (NR
15 mU/mL) to a solution
containing 50 µM sodium nitrate and various concentrations of NADH. The curves from top to bottom were
obtained in solutions containing 100, 50, 40, and 0 µM NADH. Hemoglobin (Hb) was introduced to quench
the production of NO. (Reprinted with permission from Elsevier Publishing [117].)
NO
NO
2
NaN
3
0.08
ONOO
NR
O
2
O
2
0.06
NADH
0.04
NO
2
a
0.02
b
0
0
4
8
12
16
20
Time (min)
FIGURE 1.13
Absorbance measurement of 2
,7
-dichlorodihydrofl uorescein (DCDHF), a peroxynitrite-
sensitive dye, as a function of nitrite (1 mM) and NADH (1 mM) introduction to a solution containing 100 µM
DCDHF and 30 mU/mL NR under ambient (a) and nitrogen saturated conditions (b). As can be seen, the
absorbance of DCDHF increases upon nitrite and NADH introduction only under an oxygen atmosphere,
indicative of peroxynitrite production. (Reprinted with permission from Elsevier Publishing [117].)


Search WWH ::

Custom Search