Biomedical Engineering Reference
In-Depth Information
0.4
1
a
b
0.2
c
0
400
600
800
0
0.1
l
/nm
1
300
500
0.5
0
0.5
E
/ V vs Ag/AgCl
(a)
/nm
(b)
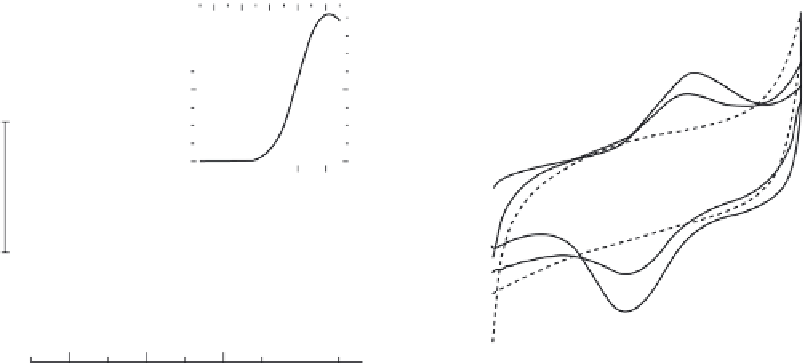
FIGURE 6.2
Panel A, UV-visible spectrum of the reconstituted SOD. The inset shows the spectrum
of CuSO
4
solution (0.56 mM). Panel B, CVs obtained at a cysteine-modifi ed Au electrode in 25 mM phos-
phate buffer containing 0.56 mM native Cu, Zn-SOD (curve a), 0.56 mM CuESOD (curve b), and 0.56 mM
EZnSOD (curve c) at 100 mV s
1
. (Reprinted from [98], with permission from Elsevier.)
1
b
a
0
1
0.5
0
0.5
E
/ V vs Ag/AgCl
FIGURE 6.3
CVs obtained at a cysteine-modifi ed Au electrode in 25 mM phosphate buffer containing
0.56 mM reconstituted SOD (curve a) or 0.56 mM native Cu, Zn-SOD (curve b). Potential scan rate, 100 mV s
1
.
(Reprinted from [98], with permission from Elsevier.)


Search WWH ::

Custom Search