Biomedical Engineering Reference
In-Depth Information
1
a
b
c
0
1
0.5
0
0.5
E/ V vs Ag/AgCl
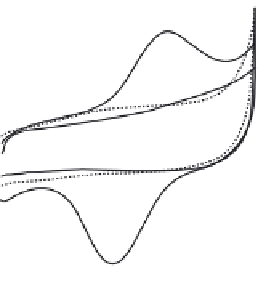
FIGURE 6.1
CVs obtained at cysteine-modifi ed (curves a and b) and bare Au (curve c) electrodes in
25 mM phosphate buffer in the presence (curves a and c) and absence (curve b) of 0.56 mM Cu, Zn-SOD.
Potential scan rate, 100 mV s
1
. (Reprinted from [98], with permission from Elsevier.)
redox waves for the Cu, Zn-SOD at a mercury electrode and further ascribed to the volt-
ammetric peaks at
0.98 V (vs SCE) to the redox reactions of Cu (II) and
Zn (II), respectively [126]. The electron transfer of the Cu, Zn-SOD promoted by the
SAM of cysteine on an Au electrode shown in Fig. 6.1 has been attributed to the electro-
chemical redox response of Cu (II), the active site of the Cu, Zn-SOD for the dismuta-
tion of O
2
•
. This was conducted by comparing the electrochemical responses between
Cu-free derivative EZnSOD (E
0.642 V and
empty), Zn-free derivative CuESOD, and the reconsti-
tuted Cu, Zn-SOD from EZnSOD and Cu
2
, as shown in Fig. 6.2. The Cu-free derivative
SOD (i.e. EZnSOD) and the Zn-free derivative SOD (i.e. CuESOD) were prepared by
removing Cu (II) and Zn (II) from the native Cu, Zn-SOD, respectively, with a method
described previously [127]. The reconstituted SOD was prepared by adding Cu
2
into
the solution of EZnSOD and incubating the mixture at room temperature for 1 hr. As
shown in Fig. 6.2 (Panel A), the absorption spectrum of the reconstituted SOD is in good
agreement with that of native Cu, Zn-SOD with
680 nm [128], but obviously dif-
ferent from that of Cu
2
aqua ion (inset in Fig. 6.2) and that of Cu-free SOD (EZnSOD)
reported by Cocco [127]. This confi rms that the reconstituted SOD can be prepared by
the procedure mentioned above (i.e. mixing Cu
2
into the solution of Cu-free SOD and
incubating the mixture at room temperature for 1 h). As can be evident from Fig. 6.2
(Panel B), no voltammetric response of EZnSOD (curve c) was observed at the cysteine-
modifi ed electrode in a potential range from
λ
max
0.5 to 0.5 V. On the other hand, similar
to that of native Cu, Zn-SOD, one pair of well-defi ned voltammetric peaks appeared in
the presence of CuESOD (curve b). This implies that the cysteine-promoted direct elec-
tron transfer of Cu, Zn-SOD depicted in Fig. 6.1 can be attributed to the electrochemical
redox reaction of the Cu moiety (not of the Zn moiety) in the potential range from
0.5
to 0.5 V. This can be further confi rmed by the same formal potentials of the reconstituted
SOD as that of the native Cu, Zn-SOD as shown in Fig. 6.3 [98].


Search WWH ::

Custom Search