Biomedical Engineering Reference
In-Depth Information
-300
A
B
-80
-200
-40
-100
0
300
600
900
0
150
300
Re
Re
Z
/ k
Z
/ k
C
-90
D
R
el
Z
W
C
m
R
a
-40
-60
-20
-30
0
0
40
80
120
0
50
100
150
Re
Re
Z
/ k
Z
/ k
R
+
R
-2
C
R
+
R
el
a
W
m
el
a
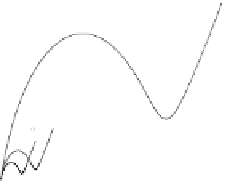
Figure 13. Impedance spectra (Nyquist plots) of a pore-spanning membrane 12
hours after incubation with DOPC vesicles containing 2 mol% gramicidin D ob-
tained in various alkali cation concentrations: 0 mM (
), 1 mM (Ɣ), 5 mM (Ƒ) and
10 mM (ż). A. LiCl, B. NaCl, and C. KCl. Buffer: 10 mM TRIS, 100 mM TMA,
pH 8.6. D. Simulated impedance spectrum (Nyquist plot) based on the equivalent
circuit shown in the inset. Electrolyte resistance
R
el
= 100 ȍ, overall resistance
R
a
=
10
5
ȍ, membrane capacitance
C
m
= 10
-7
F, Warburg impedance
Z
W
with
ı
W
=
23570 ȍ s
-0.5
.
38
membrane preparations doped with gramicidin, the ratio
m
K
/
m
Na
was calculated from three independent experiments to be 1.7 ± 0.2,
which is in good agreement with the value of 1.8 found for classi-
cal BLMs.
77
Ion selectivity and conductance ratios are reliable indicators of
the functionality of an ion channel. However, from the view of
pharmacologists, only the characteristic interaction with a modula-
tor, which blocks or activates the channel, unambiguously defines
its functionality. It is well known that divalent cations are capable
of reducing the conductance of gramicidin.
50
Thus, the same ex-
periments of cation transport were performed in the presence of


Search WWH ::

Custom Search