Biomedical Engineering Reference
In-Depth Information
200
4
F
o
0
0
4000
8000
0
4000
8000
t
o
t
o
-4
-50
Time (ms)
Time (ms)
(a) Loading waveform
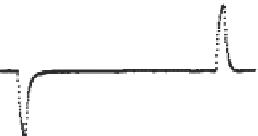
(b) Piezovoltage waveform
FIGURE 9.11
Loading and piezo-voltage wave form.
deformation occurs in cortical bone [33] and stress and strain have a linear
relationship for cortical bovine bone [34].
In Hou et al. [4], piezovoltages of the bone samples were measured
under three-point bending in an environment with relative humidity of
52%-56% and temperature of 21°C-26°C. Figure 9.11(b) shows a typical plot
of variation of piezovoltage with time under the loading profile shown in
Figure 9.11(a). It has a negative and a positive pulse corresponding to the
loading and unloading durations, respectively. The peak of the first pulse
(negative) just corresponds to the loading end point and the second pulse
peak corresponds to the unloading end point. The amplitudes of the peaks
are of the order of several millivolts. The pattern of the pulses indicates
that once the loading or unloading ends, the piezovoltage starts to decay
toward zero, which looks like an exponential relaxation process. The cor-
responding physical process was that once the piezocharge appeared on
the two electrodes, it began to discharge through the impedance of the
bone. Then, the variation of the piezocharge with time was associated with
the mechanical loads and with the physical properties of the bone, such as
impedance.
9.4.4 Results and Discussion
Hou et al. [4] found that the piezovoltage time curves of all the samples
(Figure 9.12) were similar in shape under three-point bending. Figures 9.12
and 9.13 illustrate two groups of these curves for samples numbered 1 and 2,
respectively, with different loading conditions.
After many trials of curve fitting on the measured curves (details of the
fitting scheme are described in Section 9.4.5), Hou et al. found that the piezo-
voltages showed different relaxation behaviors in the loading (or unload-
ing) and load holding processes. During loading, the piezovoltage decays
followed a nonexponential or stretched exponential law [35], whereas they
followed a typical exponential law (β = 1, known as Debye exponential