Biomedical Engineering Reference
In-Depth Information
Figure 4.10
Response of the PVDF sensor for linear load input
output voltage from each varies linearly with the applied force. A second set of experi-
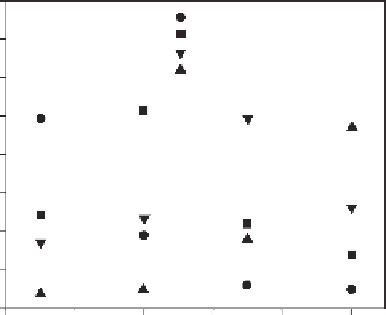
ments was conducted by applying an oscillatory force (1 N maximum) at 15 Hz to the
center of each tooth, and the output voltage from each individual sensing element was
recorded. Figure 4.11 shows the results of these experiments in which it can be seen that
when a force is applied to a tooth, the distribution of shear force (which is proportional
to the measured voltage) is almost linear and away from the location of the applied load.
When a sinusoidal force is applied, the output charge from each PVDF sensing element
is the sum of piezoelectric coefficients,
d
31
,
d
32
and
d
33
, multiplied by the magnitude of
the applied force (i.e.,
P
=
q
/(
ψ
1
d
31
+
ψ
2
d
32
+
d
33
), where
q
is the output charge,
P
is
0.8
Load applied on Touch 1
Load applied on Touch 2
Load applied on Touch 3
Load applied on Touch 4
0.7
0.6
0.5
0.4
0.3
0.2
0.1
0.0
2
4
6
8
10
12
Distance along the sensor (mm)
Figure 4.11
Measured shear stress distribution along the length of the sensor for a 1 N applied
force at Touch 1 to Touch 4, respectively