Biomedical Engineering Reference
In-Depth Information
A/D
Converter
Position
Sensor
+
−
Xr
Xd
PID
controller
A/D
converter
Motor
driver
Linear
actuator
Figure 11.9
Complete block diagram of the system
+
−
Xd
Linear actuator
& driver circuit
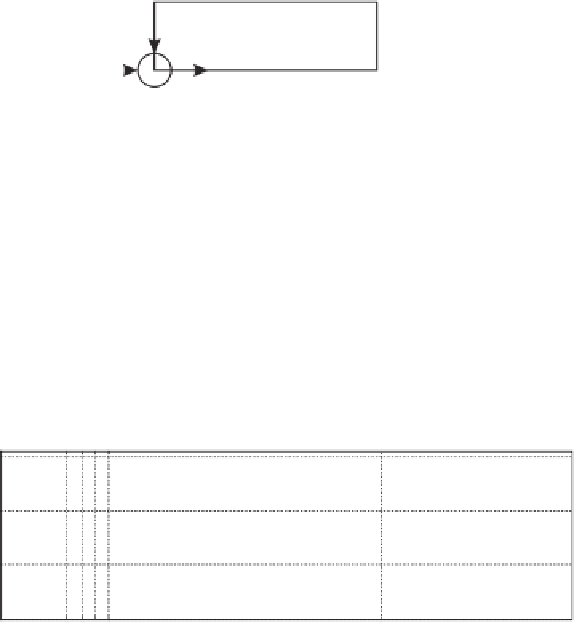
Figure 11.10
Simplified block diagram of the system
11.6.1 Linear Actuator Model
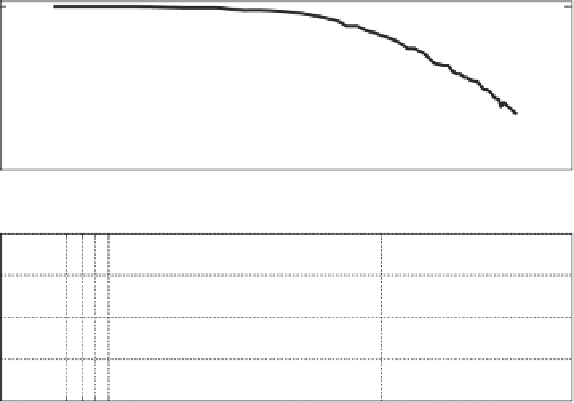
To identify the parameters in the transfer function of the actuator, a sinusoidal wave, with
unity gain and variable frequency, was applied to the system. The frequency was changed
over the range 0 - 5 Hz and the magnitude ratio between the output of actuator and input
sinusoidal signal were registered, and also the time delays for each input. Then, using
the experimental data, a Bode plot of the system (a graph of the transfer function of a
linear, time-invariant system versus frequency, plotted with a log-frequency axis to show
the system's frequency response), was traced out and shown in Figure 11.11.
0
−
10
−20
−30
10
0
10
1
freq.(rad/sec)
0
−1
−2
−
3
−4
10
0
10
1
freq.(rad/sec)
Figure 11.11
Frequency response of the system