Cryptography Reference
In-Depth Information
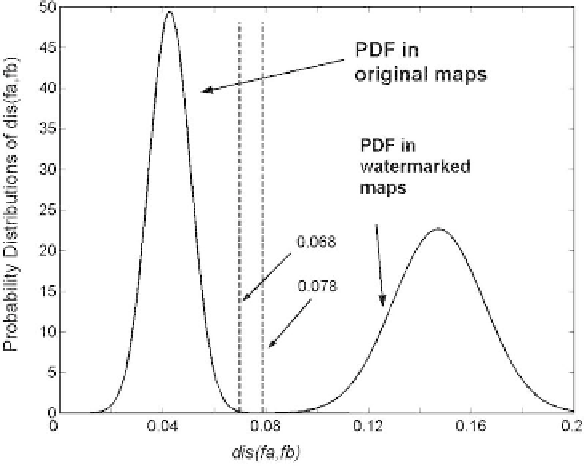
Threshold Determination
The distribution of dis(f
a
,f
b
) is used to determine the threshold T . A 1000 dif-
ferent blocks of a big contour map are used as the original maps and dis(f
a
,f
b
)
is then calculated for each of them before and after watermarking. Figure 6.8
indicates the resulting distributions of dis(f
a
,f
b
). The left curve in the fig-
ure is the distribution of dis(f
a
,f
b
) in original maps, and the right is the
distribution in watermarked maps. As shown in the figure, if is T selected
as 0.078, minimum detection error could be achieved with the false-positive-
error of 6.1510
−5
. To enhance
the robustness to additive noise attack, a smaller T should be selected. In this
scheme, T is selected as 0.068 for the purpose of resisting the low amplitude
noises. The experimental results in the remaining part will indicate that the
selection is reasonable.
−6
and the false-negative-error of 4.3310
Fig. 6.8.
The distribution of dis(f
a
,f
b
).
Performance
The original map shown in Fig. 6.6 is used for experiments. It is part of a
contour map with the scale 1:10000. The tolerance (τ ) of the coordinates is
1 meter(m). The size of the divided map patch is 20m20m. The factor α is
chosen as 0.6. The threshold for feature point detection can be calculated as
T
DP
= τ/(1−α)=2.5m. The threshold T is set to 0.068. The performance
of the scheme is discussed in following aspects.