Biomedical Engineering Reference
In-Depth Information
(a)
(b)
(c)
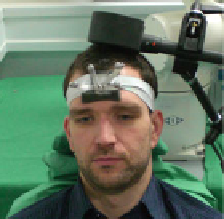
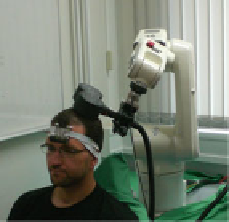
Fig. 2.4 Three scenarios for motion recording. a The coil is fixed in a holder and the subject is
asked not to move the head. b An additional head rest helps the subject to maintain its head pose.
c The coil is mounted to a robot and motion is actively compensated by respective coil motion.
Note that in all three scenarios the actual head motion is recorded using optical markers attached
to the subjects head
reason, head motion is not restricted. Figure
2.4
illustrates these three scenarios.
Note that, even though not necessarily required, we use a coil for recording of head
motion to simulate a realistic TMS setup.
A Polaris stereo-optic infrared tracking system (Northern Digital, Inc.,
Waterloo, Ontario, Canada) records the head motion by tracking a passive marker
at the subjects head. The tracking frequency is approximately 30 Hz. We calibrate
the tracking system to the robot to store the head motion in robot coordinates (cf.
subjects (aged 25-30 years) have participated in the recording.
Note that the tracking system provides full 6 Degrees of Freedom (DOF) for
tracking the marker. Hence, we measure the rotational head motion in degrees
besides the translational movement.
2.2.2 Electric Field Measurements
For stimulus intensity measurements, we have designed a custom built sensor
consisting of a plastic bar and two perpendicular wires (Fig.
2.5
B). The plastic bar
has a diameter of 10 mm and a length of 220 mm. The sensor is embedded in a
styrofoam head phantom with dimensions similar to a human head (Fig.
2.5
A). The
sensor is located 15 mm below the outer head surface and at the head's midline
(denoted with a red circle in Fig.
2.5
D). Note that the styrofoam head allows to use
the same setup as with actual patients, even though not necessary for electric field
measurements. The sensor measures the induced electric field in the x/y-plane in the
intersecting wires on top of the bar (Fig.
2.5
C). Thus, the sensor uses two channels
perpendicular to one another to detect the induced electric field in the x- and the
y-axis simultaneously. This way, this sensor setup represents the brain's cortical
topology, and is therefore sufficient for stimulus intensity measurements.

Search WWH ::

Custom Search