Biomedical Engineering Reference
In-Depth Information
The same model can also be used to simulate glucose
regulation in a diabetic. The MATLAB script for the
model parameters is
% Set the workspace variables for the
% Simulink model VanRiel.mdl
% Basal Glucose and Insulin
Gb
¼
92;
Ib
¼
11;
G0
¼
365;
% Model constants
SI
¼
0.7e-4;
k3
¼
0.01;
k1
¼
1.7e-2;
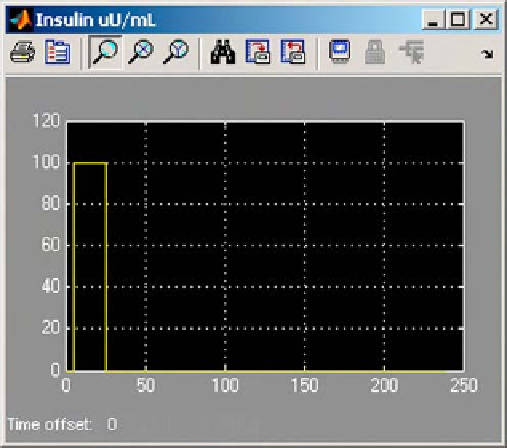
Figure 2.2-14 Insulin concentration.
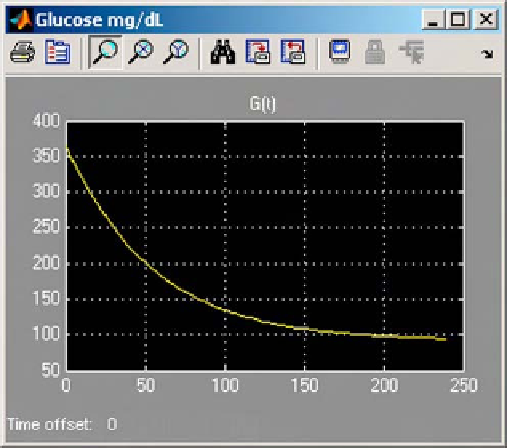
Figure 2.2-13 Glucose concentration.
and if the simulation is run for 240 minutes with the
same insulin profile, the glucose concentration is shown
in
Fig. 2.2-13
.
The insulin concentration is shown in
Fig. 2.2-14
.
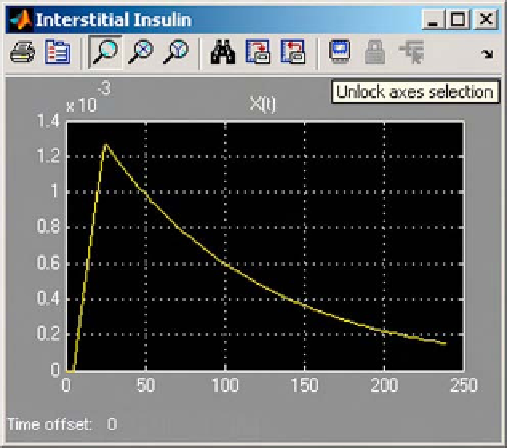
The interstitial
Figure 2.2-15 Interstitial insulin concentration.
insulin concentration is shown in
clearance: Glomerular Filtration Rate, Effective Renal
Plasma Flow, or Tubular Extraction Rate.
There are a number of techniques for evaluating renal
kinetics, some of which are based on measuring radio-
nuclide concentration over time from urine and plasma;
plasma alone; or using a gamma camera to measure iso-
tope concentration in the kidneys as the isotope is
extracted from the plasma. Renal function is assessed by
comparing clinical measurements to simulation results
based on a model of normal kinetics. The last two of the
three cases are easiest to model with only two com-
partments, central and peripheral.
One such two-compartment model was described by
Estelberger and Popper (2002)
. In that model, there are
two functionally separated spaces, a well-perfused
Fig. 2.2-15
.
The NIH-NIDDK criterion for diabetes is a glucose
concentration of 200 mg/dL or more, 2 hours after the
glucose administration. This simulation shows a profile
that would be diagnosed as pre-diabetes, or impaired
glucose tolerance.
2.2.5 Renal clearance
Renal clearance
(
Cl
R
) is a measure of kidney transport in
units of volume of plasma per unit time. The volume of
plasma measured is that volume for which a given sub-
stance (e.g., urea or drugs) is completely removed per
minute. There are a number of specific forms of renal