Biomedical Engineering Reference
In-Depth Information
polymers for biomedical applications. The ultimate
strength of polymers is the stress at or near failure. For
most materials, failure is catastrophic (complete break-
age). However, for some semicrystalline materials, the
failure point may be defined by the stress point where
large inelastic deformation starts (yielding). The tough-
ness of a polymer is related to the energy absorbed at
failure and is proportional to the area under the stress-
strain curve.
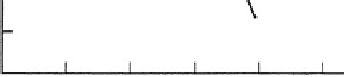
The fatigue behavior of polymers is also important in
evaluating materials for applications where dynamic
strain is applied. For example, polymers that are used in
the artificial heart must be able to withstand many cycles
of pulsating motion. Samples that are subjected to re-
peated cycles of stress and release, as in a flexing test, fail
(break) after a certain number of cycles. The number of
cycles to failure decreases as the applied stress level is
increased, as shown in
Fig. 3.2.2-10
. For some materials,
a minimum stress exists below which failure does not
occur in a measurable number of cycles.
10
Semicrystalline
9
8
Crosslinked
7
Linear amorphous
6
-100
-50
0
50
100
150
Temperature (°C)
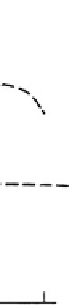
Fig. 3.2.2-11 Dynamic mechanical behavior of polymers.
discussed in the section on characterization techniques.
All polymers have a
T
g
, but only polymers with regular
chain architecture can pack well, crystallize, and exhibit
a
T
m
. The
T
g
is always below the
T
m
.
The viscoelastic responses of polymers can also be used
to classify their thermal behavior. The modulus versus
temperature curves shown in
Fig. 3.2.2-11
illustrate be-
haviors typical of linear amorphous, cross-linked, and
semicrystalline polymers. The response curves are char-
acterized by a glassy modulus below
T
g
of approximately
3
10
9
Pa. For linear amorphous polymers, increasing
temperature induces the onset of the glass transition
region where, in a 5-10
C temperature span (depending
on heating rate), the modulus drops by three orders of
magnitude, and the polymer is transformed from a stiff
glass to a leathery material. The relatively constant mod-
ulus region above
T
g
is the rubbery plateau region where
long-range segmental motion is occurring but thermal
energy is insufficient to overcome entanglement in-
teractions that inhibit flow. This is the target region for
many biomedical applications. Finally, at high enough
temperatures, the polymer begins to flow, and a sharp
decrease in modulus is seen over a narrow temperature
range. This is the region where polymers are processed
into various shapes, depending on their end use.
Crystalline polymers exhibit the same general features
in modulus versus temperature curves as amorphous
polymers; however, crystalline polymers possess a higher
plateau modulus owing to the reinforcing effect of the
crystallites. Crystalline polymers tend to be tough, duc-
tile plastics whose properties are sensitive to processing
history. When heated above their flow point, they can be
melt processed and will crystallize and become rigid
again upon cooling.
Chemically cross-linked polymers exhibit modulus
versus temperature behavior analogous to that of linear
amorphous polymers until the flow regime is approached.
Thermal properties
In the liquid or melt state, a noncrystalline polymer
possesses enough thermal energy for long segments of
each polymer to move randomly (Brownian motion). As
the melt is cooled, a temperature is eventually reached at
which all long-range segmental motions cease. This is the
glass transition temperature (
T
g
), and it varies from
polymer to polymer. Polymers used below their
T
g
, such
as PMMA, tend to be hard and glassy, while polymers
used above their
T
g
, such as SR, are rubbery. Polymers
with any crystallinity will also exhibit a melting tem-
perature (
T
m
) owing to melting of the crystalline phase.
These polymers, such as PET, PP, and nylon, will be rel-
atively hard and strong below
T
g
, and tough and strong
above
T
g
. Thermal transitions in polymers can be mea-
sured by differential scanning calorimetry (DSC), as
Fig. 3.2.2-10 Fatigue properties of polymers.