Biomedical Engineering Reference
In-Depth Information
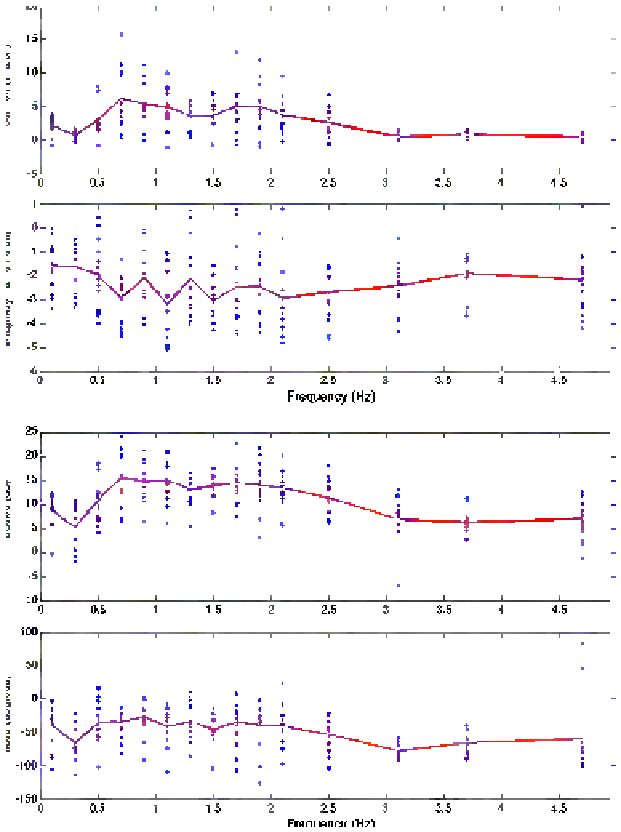
Fig. 9.17
Impedance in its complex representation and its equivalent Bode plot for the COPD di-
agnosed group. The
stars
denote estimated impedance using (
3.8
), while a
continuous line
denotes
the averaged values
To verify if the
T
index changes by COPD severity, the subdivision of the COPD
patients according to the GOLD classification is used. Although the number of pa-
tients is too low to provide a meaningful statistical difference, Fig.
9.26
shows a
clear difference in the amount of non-linear distortions with gradual severity of the
disease. This indeed delivers a proof of concept that non-linearity increases with
disease severity (
p
0
.
01).